Appendix C: Additional data analysis results
Support for developing AI
Table C.1 shows the regression results used to produce Figure 2.4.
Table C.1: Predicting support for developing AI using demographic characteristics: results from a multiple linear regression that includes all demographic variables; outcome standardized to have mean 0 and unit variance
| (Intercept) |
-0.27 (0.09)** |
| Age 38-53 |
-0.16 (0.06)** |
| Age 54-72 |
-0.18 (0.06)** |
| Age 73 and older |
-0.16 (0.10) |
| Male |
0.17 (0.05)*** |
| Non-white |
-0.02 (0.05) |
| Some college |
-0.01 (0.06) |
| College+ |
0.18 (0.06)** |
| Employed (full- or part-time) |
0.03 (0.05) |
| Democrat |
0.20 (0.06)** |
| Independent/Other |
-0.05 (0.06) |
| Income $30-70K |
0.01 (0.06) |
| Income $70-100K |
0.13 (0.09) |
| Income more than $100K |
0.16 (0.08)* |
| Prefer not to say income |
-0.14 (0.07) |
| No religious affiliation |
0.16 (0.05)** |
| Other religion |
0.14 (0.08) |
| Born-again Christian |
-0.04 (0.06) |
| CS or engineering degree |
0.05 (0.09) |
| CS or programming experience |
0.30 (0.06)*** |
| N = 2000 |
F(19,1980) = 11.75; p-value: <0.001 |
Survey experiment and cross-national comparison: AI and/or robots should be carefully managed
We present the percentage of “don’t know” or missing responses to the survey question (see Appendix B for the survey question text). Regression analysis shows that the varying the term used (i.e., AI, AI and robots, and robots) does not change responses to the statement that such technologies should be carefully managed. This finding is robust to a regression where we controlled for “don’t know” or missing responses. In Table C.6, we present the distribution of responses to the statement by country.
Table C.2: Survey experiment attrition check: agreement with statement that AI and/or robots should be carefully managed
| AI |
11.39 |
11.39 |
0 |
| AI and robots |
13.26 |
13.26 |
0 |
| Robots |
9.60 |
9.60 |
0 |
Table C.3: Survey experiment attrition check: agreement with statement that AI and/or robots should be carefully managed
| (Intercept) |
0.11 (0.01)*** |
| AI and robots |
0.02 (0.02) |
| Robots |
-0.01 (0.02) |
| N = 2000 |
F(2, 1997) = 1.03; p-value: 0.359 |
Table C.4: Survey experiment results: agreement with statement that AI and/or robots should be carefully managed
| (Intercept) |
1.49 (0.03)*** |
| AI and robots |
-0.03 (0.04) |
| Robots |
-0.09 (0.05) |
| N = 2000 |
F(2, 1997) = 1.92; p-value: 0.146 |
Table C.5: Survey experiment results: agreement with statement that AI and/or robots should be carefully managed (controlling for DK/missing responses)
| (Intercept) |
1.46 (0.03)*** |
| AI and robots |
0.03 (0.05) |
| Robots |
-0.07 (0.05) |
| N = 2000 |
F(5, 1994) = 0.91; p-value: 0.471 |
Table C.6: Distribution of responses to statement that AI and robots should be carefully managed by country (in percentages); EU countries data from Eurobarometer
| Austria |
3 |
7 |
43 |
43 |
4 |
| Belgium |
1 |
9 |
40 |
48 |
2 |
| Bulgaria |
1 |
2 |
24 |
65 |
8 |
| Croatia |
4 |
8 |
37 |
47 |
4 |
| Cyprus |
1 |
2 |
26 |
67 |
4 |
| Czech Republic |
2 |
7 |
37 |
50 |
4 |
| Denmark |
1 |
4 |
25 |
66 |
4 |
| Estonia |
0 |
4 |
39 |
51 |
6 |
| European Union |
2 |
5 |
35 |
53 |
5 |
| Finland |
1 |
4 |
29 |
63 |
3 |
| France |
1 |
3 |
31 |
62 |
3 |
| Germany |
2 |
4 |
32 |
59 |
3 |
| Greece |
1 |
3 |
23 |
71 |
2 |
| Hungary |
4 |
12 |
35 |
45 |
4 |
| Ireland |
1 |
4 |
37 |
54 |
4 |
| Italy |
3 |
8 |
43 |
40 |
6 |
| Latvia |
1 |
3 |
29 |
63 |
4 |
| Lithuania |
0 |
4 |
35 |
57 |
4 |
| Luxembourg |
1 |
4 |
33 |
58 |
4 |
| Malta |
2 |
4 |
46 |
38 |
10 |
| Netherlands |
1 |
2 |
22 |
74 |
1 |
| Poland |
2 |
8 |
44 |
42 |
4 |
| Portugal |
2 |
2 |
37 |
48 |
11 |
| Romania |
5 |
12 |
33 |
42 |
8 |
| Slovakia |
0 |
5 |
44 |
46 |
5 |
| Slovenia |
2 |
6 |
37 |
52 |
3 |
| Spain |
1 |
3 |
40 |
47 |
9 |
| Sweden |
1 |
2 |
18 |
75 |
4 |
| United Kingdom |
1 |
3 |
34 |
57 |
5 |
| United States |
1 |
5 |
30 |
52 |
12 |
Harmful consequences of AI in the context of other global risks
Table C.7 summarizes responses to 15 potential global risks.
Table C.7: Summary statistics: the American public’s perceptions of 15 potential global risks
| Failure to address climate change |
56% |
2.25 |
666 |
| Failure of regional/global governance |
55% |
2.46 |
652 |
| Conflict between major countries |
60% |
2.68 |
625 |
| Weapons of mass destruction |
49% |
3.04 |
645 |
| Large-scale involuntary migration |
57% |
2.65 |
628 |
| Spread of infectious diseases |
50% |
2.69 |
620 |
| Water crises |
54% |
2.90 |
623 |
| Food crises |
52% |
2.76 |
1073 |
| Harmful consequences of AI |
45% |
2.29 |
573 |
| Harmful consequences of synthetic biology |
45% |
2.33 |
630 |
| Cyber attacks |
68% |
2.85 |
650 |
| Terrorist attacks |
60% |
2.62 |
635 |
| Global recession |
56% |
2.61 |
599 |
| Extreme weather events |
65% |
2.73 |
613 |
| Natural disasters |
69% |
2.87 |
637 |
Survey experiment: what the public considers AI, automation, machine learning, and robotics
We formally tested whether or not respondents think AI, automation, machine learning, and robotics are used in different applications. (See Appendix B for the survey question text.) For each technological application, we used an \(F\)-test to test whether any of terms randomly assigned to the respondents affect respondents’ selecting that application. Because we ran 10 \(F\)-tests, we used the Bonferroni correction to control the familywise error rate. The Bonferroni correction rejected the null hypothesis at alpha level \(\alpha/10\), instead of \(\alpha\). For instance, to test whether the \(F\)-static is significant at the 5% level, we set the alpha level at \(\alpha/10 = 0.005\). Our results (in Table C.8) show that except for social robots, respondents think that AI, automation, machine learning, and robotics are used in each of the applications presented in the survey.
Table C.8: Respondents distinguish between AI, automation, machine learning, and robotics
| Virtual assistants (e.g., Siri, Google Assistant, Amazon Alexa) |
F(3, 1996) = 18.12 |
<0.001 |
Yes |
| Smart speakers (e.g., Amazon Echo, Google Home, Apple Homepod) |
F(3, 1996) = 24.76 |
<0.001 |
Yes |
| Facebook photo tagging |
F(3, 1996) = 20.22 |
<0.001 |
Yes |
| Google Search |
F(3, 1996) = 37.30 |
<0.001 |
Yes |
| Recommendations for Netflix movies or Amazon ebooks |
F(3, 1996) = 33.69 |
<0.001 |
Yes |
| Google Translate |
F(3, 1996) = 24.62 |
<0.001 |
Yes |
| Driverless cars and trucks |
F(3, 1996) = 9.08 |
<0.001 |
Yes |
| Social robots that can interact with humans |
F(3, 1996) = 1.05 |
0.369 |
No |
| Industrial robots used in manufacturing |
F(3, 1996) = 55.72 |
<0.001 |
Yes |
| Drones that do not require a human controller |
F(3, 1996) = 9.68 |
<0.001 |
Yes |
Next, we investigated the problem of respondents not selecting technological applications where it would be logical to pick them (e.g., not selecting industrial robots or social robots when presented with the term “robotics”). Our regression analysis shows that this type of non-response is correlated with respondents’ inattention.
We used two measures as a proxy for inattention:
- time to complete the survey
- the absolute deviation from the median time to complete the survey.
Because the distribution of completion times is heavily skewed right, we used absolute deviation from the median, as opposed to the mean. The median is 13 minutes whereas the mean is 105 minutes. We incorporated the second measure because we suspected that people who took very little time or a very long time to complete the survey were inattentive.
We used three outcomes that measured non-response:
- the number of items selected
- not selecting “none of the above”
- selecting items containing the word “robots” for respondents assigned to consider “robotics”
Using multiple regression, we showed that inattention predicts non-response measured by the three outcomes above (see Tables C.9, C.10, and C.11).
Table C.9: Correlation between survey completion time and number of selected items
| (Intercept) |
3.58 (0.17)*** |
| Survey completion time (min) |
0.14 (0.01)*** |
| Absolute deviation from median survey completion time (min) |
-0.14 (0.01)*** |
| Term: automation |
0.98 (0.22)*** |
| Term: machine learning |
-0.09 (0.22) |
| Term: Robotics |
-0.51 (0.20)* |
| N = 2000 |
F(5, 1994) = 47.47; p-value: <0.001 |
Table C.10: Correlation between survey completion time and not selecting ‘none of the above’
| (Intercept) |
0.79 (0.02)*** |
| Survey completion time (min) |
0.01 (<0.01)*** |
| Absolute deviation from median survey completion time (min) |
-0.01 (<0.01)*** |
| Term: automation |
0.05 (0.02)* |
| Term: machine learning |
-0.04 (0.02) |
| Term: Robotics |
0.04 (0.02) |
| N = 2000 |
F(5, 1994) = 13.16; p-value: <0.001 |
Table C.11: Correlation between survey completion time and selecting ‘robots’ when assigned the term ‘robotics’
| (Intercept) |
0.87 (0.06)*** |
| Survey completion time (min) |
0.06 (0.01)*** |
| Absolute deviation from median survey completion time (min) |
-0.06 (0.01)*** |
| N = 486 |
F(2, 483) = 50.55; p-value: <0.001 |
AI governance challenges: prioritizing governance challenges
We compared respondents’ perceived likelihood of each governance challenge impacting large numbers of people in the U.S. with respondents’ perceived likelihood of each governance challenge impacting large numbers of people around the world. (See Appendix B for the survey question text.) For each governance challenge, we used linear regression to estimate the difference between responses to the U.S. question and the world question.
Because we ran 13 tests, we used the Bonferroni correction to control the familywise error rate. In our case, the Bonferroni correction rejected the null hypothesis at alpha level \(\alpha/13\), instead of \(\alpha\). To test whether the differences are significant at the 5% level, we set the alpha level at \(\alpha/13 = 0.004\). According to Table C.12, Americans perceive that all governance challenges, except for protecting data privacy and ensuring safe autonomous vehicles, are more likely to impact people around the world than in the U.S. specifically. In particular, Americans think that autonomous weapons are 7.6 percentage points more likely to impact people around the world than in the U.S.
Table C.12: Comparing perceived likelihood: in U.S. vs. around the world; each difference is the U.S. mean likelihood subtracted from the world mean likelihood
| Hiring bias |
59.8 |
2.5 (0.8) |
0.001 |
Yes |
| Criminal justice bias |
55.6 |
2.5 (0.8) |
0.003 |
Yes |
| Disease diagnosis |
60.4 |
2.1 (0.6) |
0.001 |
Yes |
| Data privacy |
66.9 |
1.7 (0.6) |
0.010 |
No |
| Autonomous vehicles |
61.8 |
-0.7 (0.8) |
0.401 |
No |
| Digital manipulation |
68.6 |
2.6 (0.7) |
<0.001 |
Yes |
| Cyber attacks |
66.2 |
3.2 (0.9) |
<0.001 |
Yes |
| Surveillance |
69.0 |
2.2 (0.7) |
0.002 |
Yes |
| U.S.-China arms race |
60.3 |
3.0 (0.7) |
<0.001 |
Yes |
| Value alignment |
60.4 |
3.6 (0.7) |
<0.001 |
Yes |
| Autonomous weapons |
54.7 |
7.6 (0.8) |
<0.001 |
Yes |
| Technological unemployment |
62.3 |
2.3 (0.7) |
<0.001 |
Yes |
| Critical AI systems failure |
55.2 |
3.1 (0.8) |
<0.001 |
Yes |
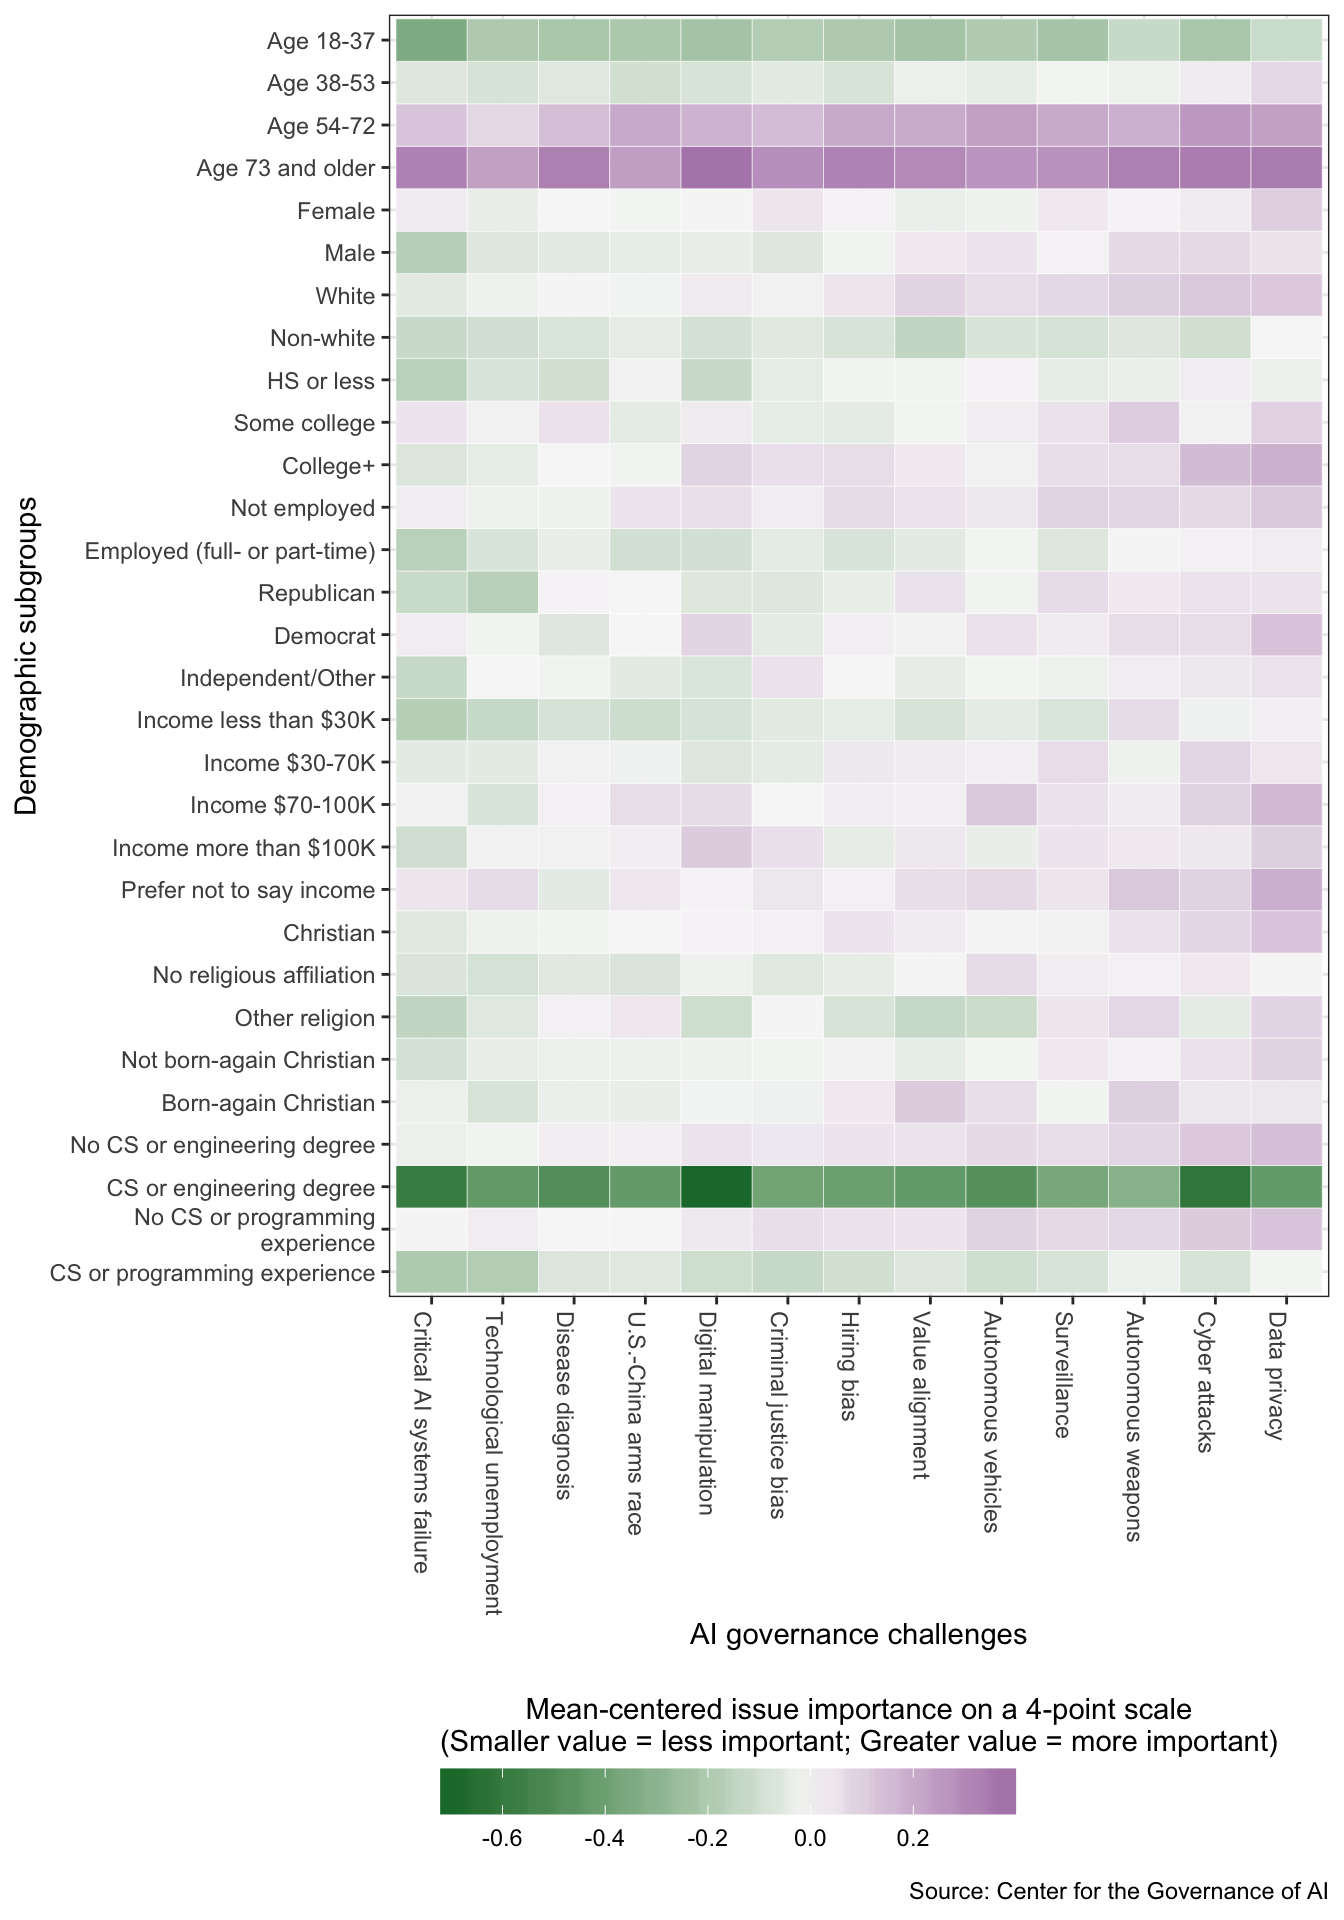
To highlight the differences between the responses of demographic subgroups regarding issue importance, we created an additional graph (Figure C.1). Here, we subtracted the overall mean of perceived issue importance across all responses from each subgroup-governance challenge mean. Table C.15 shows the results from a saturated regression predicting perceived issue importance using demographic variables, AI governance challenge, and interactions between the two types of variables.
Table C.13: Perception of AI governance challenges in the U.S.: summary statistics table
| Surveillance |
69% |
2.56 |
1.77 |
| Data privacy |
67% |
2.62 |
1.75 |
| Digital manipulation |
69% |
2.53 |
1.74 |
| Cyber attacks |
66% |
2.59 |
1.71 |
| Autonomous vehicles |
62% |
2.56 |
1.58 |
| Technological unemployment |
62% |
2.50 |
1.56 |
| Value alignment |
60% |
2.55 |
1.54 |
| Disease diagnosis |
60% |
2.52 |
1.52 |
| U.S.-China arms race |
60% |
2.52 |
1.52 |
| Hiring bias |
60% |
2.54 |
1.52 |
| Autonomous weapons |
55% |
2.58 |
1.42 |
| Criminal justice bias |
56% |
2.53 |
1.41 |
| Critical AI systems failure |
55% |
2.47 |
1.36 |
Table C.14: Perception of AI governance challenges in the world: summary statistics table
| Surveillance |
71% |
2.56 |
1.82 |
| Digital manipulation |
71% |
2.53 |
1.80 |
| Cyber attacks |
69% |
2.59 |
1.80 |
| Data privacy |
69% |
2.62 |
1.80 |
| Value alignment |
64% |
2.55 |
1.63 |
| Technological unemployment |
65% |
2.50 |
1.62 |
| Autonomous weapons |
62% |
2.58 |
1.61 |
| U.S.-China arms race |
63% |
2.52 |
1.60 |
| Hiring bias |
62% |
2.54 |
1.58 |
| Disease diagnosis |
63% |
2.52 |
1.58 |
| Autonomous vehicles |
61% |
2.56 |
1.56 |
| Criminal justice bias |
58% |
2.53 |
1.47 |
| Critical AI systems failure |
58% |
2.47 |
1.44 |
Table C.15: Results from a saturated regression predicting perceived issue importance using demographic variables, AI governance challenge, and interactions between the two types of variables; the coefficients for the interactions variables are not shown due to space constraints
| (Intercept) |
2.25 (0.11)*** |
| Age 38-53 |
0.11 (0.07) |
| Age 54-72 |
0.35 (0.06)*** |
| Age 73 and older |
0.44 (0.07)*** |
| Male |
0.02 (0.05) |
| Non-white |
-0.01 (0.05) |
| Some college |
0.03 (0.07) |
| College+ |
0.15 (0.07)* |
| Employed (full- or part-time) |
-0.09 (0.06) |
| Income $30-70K |
0.09 (0.08) |
| Income $70-100K |
0.13 (0.10) |
| Income more than $100K |
-0.01 (0.10) |
| Prefer not to say income |
0.04 (0.08) |
| Democrat |
0.13 (0.07) |
| Independent/Other |
0.14 (0.07) |
| No religious affiliation |
-0.04 (0.06) |
| Other religion |
-0.05 (0.08) |
| Born-again Christian |
0.07 (0.07) |
| CS or engineering degree |
-0.35 (0.10)*** |
| CS or programming experience |
-0.01 (0.07) |
| Criminal justice bias |
0.05 (0.13) |
| Disease diagnosis |
-0.06 (0.14) |
| Data privacy |
0.16 (0.13) |
| Autonomous vehicles |
-0.07 (0.14) |
| Digital manipulation |
-0.14 (0.15) |
| Cyber attacks |
0.05 (0.14) |
| Surveillance |
<0.01 (0.15) |
| U.S.-China arms race |
0.04 (0.13) |
| Value alignment |
-0.06 (0.13) |
| Autonomous weapons |
0.06 (0.14) |
| Technological unemployment |
-0.12 (0.14) |
| Critical AI systems failure |
-0.27 (0.15) |
| N = 10000 observations, 2000 respondents |
F(259,1999) = 3.36; p-value: <0.001 |
Trust in various actors to develop and manage AI in the interest of the public
Table C.16 displays the mean level of trust the public expresses in various actors to develop and manage AI in the interest of the public.
Table C.16: Trust in various actors to develop and manage AI in the interest of the public: mean responses
| U.S. military |
1.56 (MOE: +/-0.07); N = 638 |
|
| U.S. civilian government |
1.16 (MOE: +/-0.07); N = 671 |
|
| NSA |
1.28 (MOE: +/-0.07); N = 710 |
|
| FBI |
1.21 (MOE: +/-0.08); N = 656 |
|
| CIA |
1.21 (MOE: +/-0.07); N = 730 |
|
| U.S. federal government |
|
1.05 (MOE: +/-0.07); N = 743 |
| U.S. state governments |
|
1.05 (MOE: +/-0.07); N = 713 |
| NATO |
1.17 (MOE: +/-0.06); N = 695 |
|
| Intergovernmental research organizations (e.g., CERN) |
1.42 (MOE: +/-0.07); N = 645 |
1.27 (MOE: +/-0.06); N = 747 |
| International organizations |
|
1.10 (MOE: +/-0.06); N = 827 |
| UN |
|
1.06 (MOE: +/-0.06); N = 802 |
| Tech companies |
1.44 (MOE: +/-0.07); N = 674 |
1.33 (MOE: +/-0.07); N = 758 |
| Google |
1.34 (MOE: +/-0.08); N = 645 |
1.20 (MOE: +/-0.07); N = 767 |
| Facebook |
0.85 (MOE: +/-0.07); N = 632 |
0.91 (MOE: +/-0.07); N = 741 |
| Apple |
1.29 (MOE: +/-0.07); N = 697 |
1.20 (MOE: +/-0.07); N = 775 |
| Microsoft |
1.40 (MOE: +/-0.08); N = 597 |
1.24 (MOE: +/-0.07); N = 771 |
| Amazon |
1.33 (MOE: +/-0.07); N = 685 |
1.24 (MOE: +/-0.07); N = 784 |
| Non-profit (e.g., OpenAI) |
1.44 (MOE: +/-0.07); N = 659 |
|
| University researchers |
1.56 (MOE: +/-0.07); N = 666 |
|
| Non-government scientific organization (e.g., AAAI) |
|
1.35 (MOE: +/-0.06); N = 792 |
| Partnership on AI |
|
1.35 (MOE: +/-0.06); N = 780 |
Survey experiment: comparing perceptions of U.S. vs. China AI research and development
A substantial percentage of respondents selected “I don’t know” when answering this survey question. (See Appendix B for the survey question text.) Our regression analysis shows that there is a small but statistically significant difference between respondents’ perception of R&D in the U.S. as compared to in China, as seen in Tables C.19 and C.20.
Table C.17: Survey experiment attrition check: comparing U.S. and China’s AI research and development
| China |
26.48 |
26.48 |
0 |
| U.S. |
22.77 |
22.77 |
0 |
Table C.18: Survey experiment attrition check: comparing U.S. and China’s AI research and development
| (Intercept) |
0.27 (0.01)*** |
| U.S. |
-0.04 (0.02) |
| N = 2000 |
F(1, 1998) = 3.12; p-value: 0.078 |
Table C.19: Survey experiment results: comparing U.S. and China’s AI research and development
| (Intercept) |
1.74 (0.02)*** |
| U.S. |
-0.08 (0.03)* |
| N = 2000 |
F(1, 1998) = 6.58; p-value: 0.01 |
Table C.20: Survey experiment results: comparing U.S. and China’s AI research and development (controlling for DK/missing responses)
| (Intercept) |
1.74 (0.02)*** |
| U.S. |
-0.08 (0.03)** |
| N = 2000 |
F(3, 1996) = 6.14; p-value: <0.001 |
Survey experiment: U.S.-China arms race
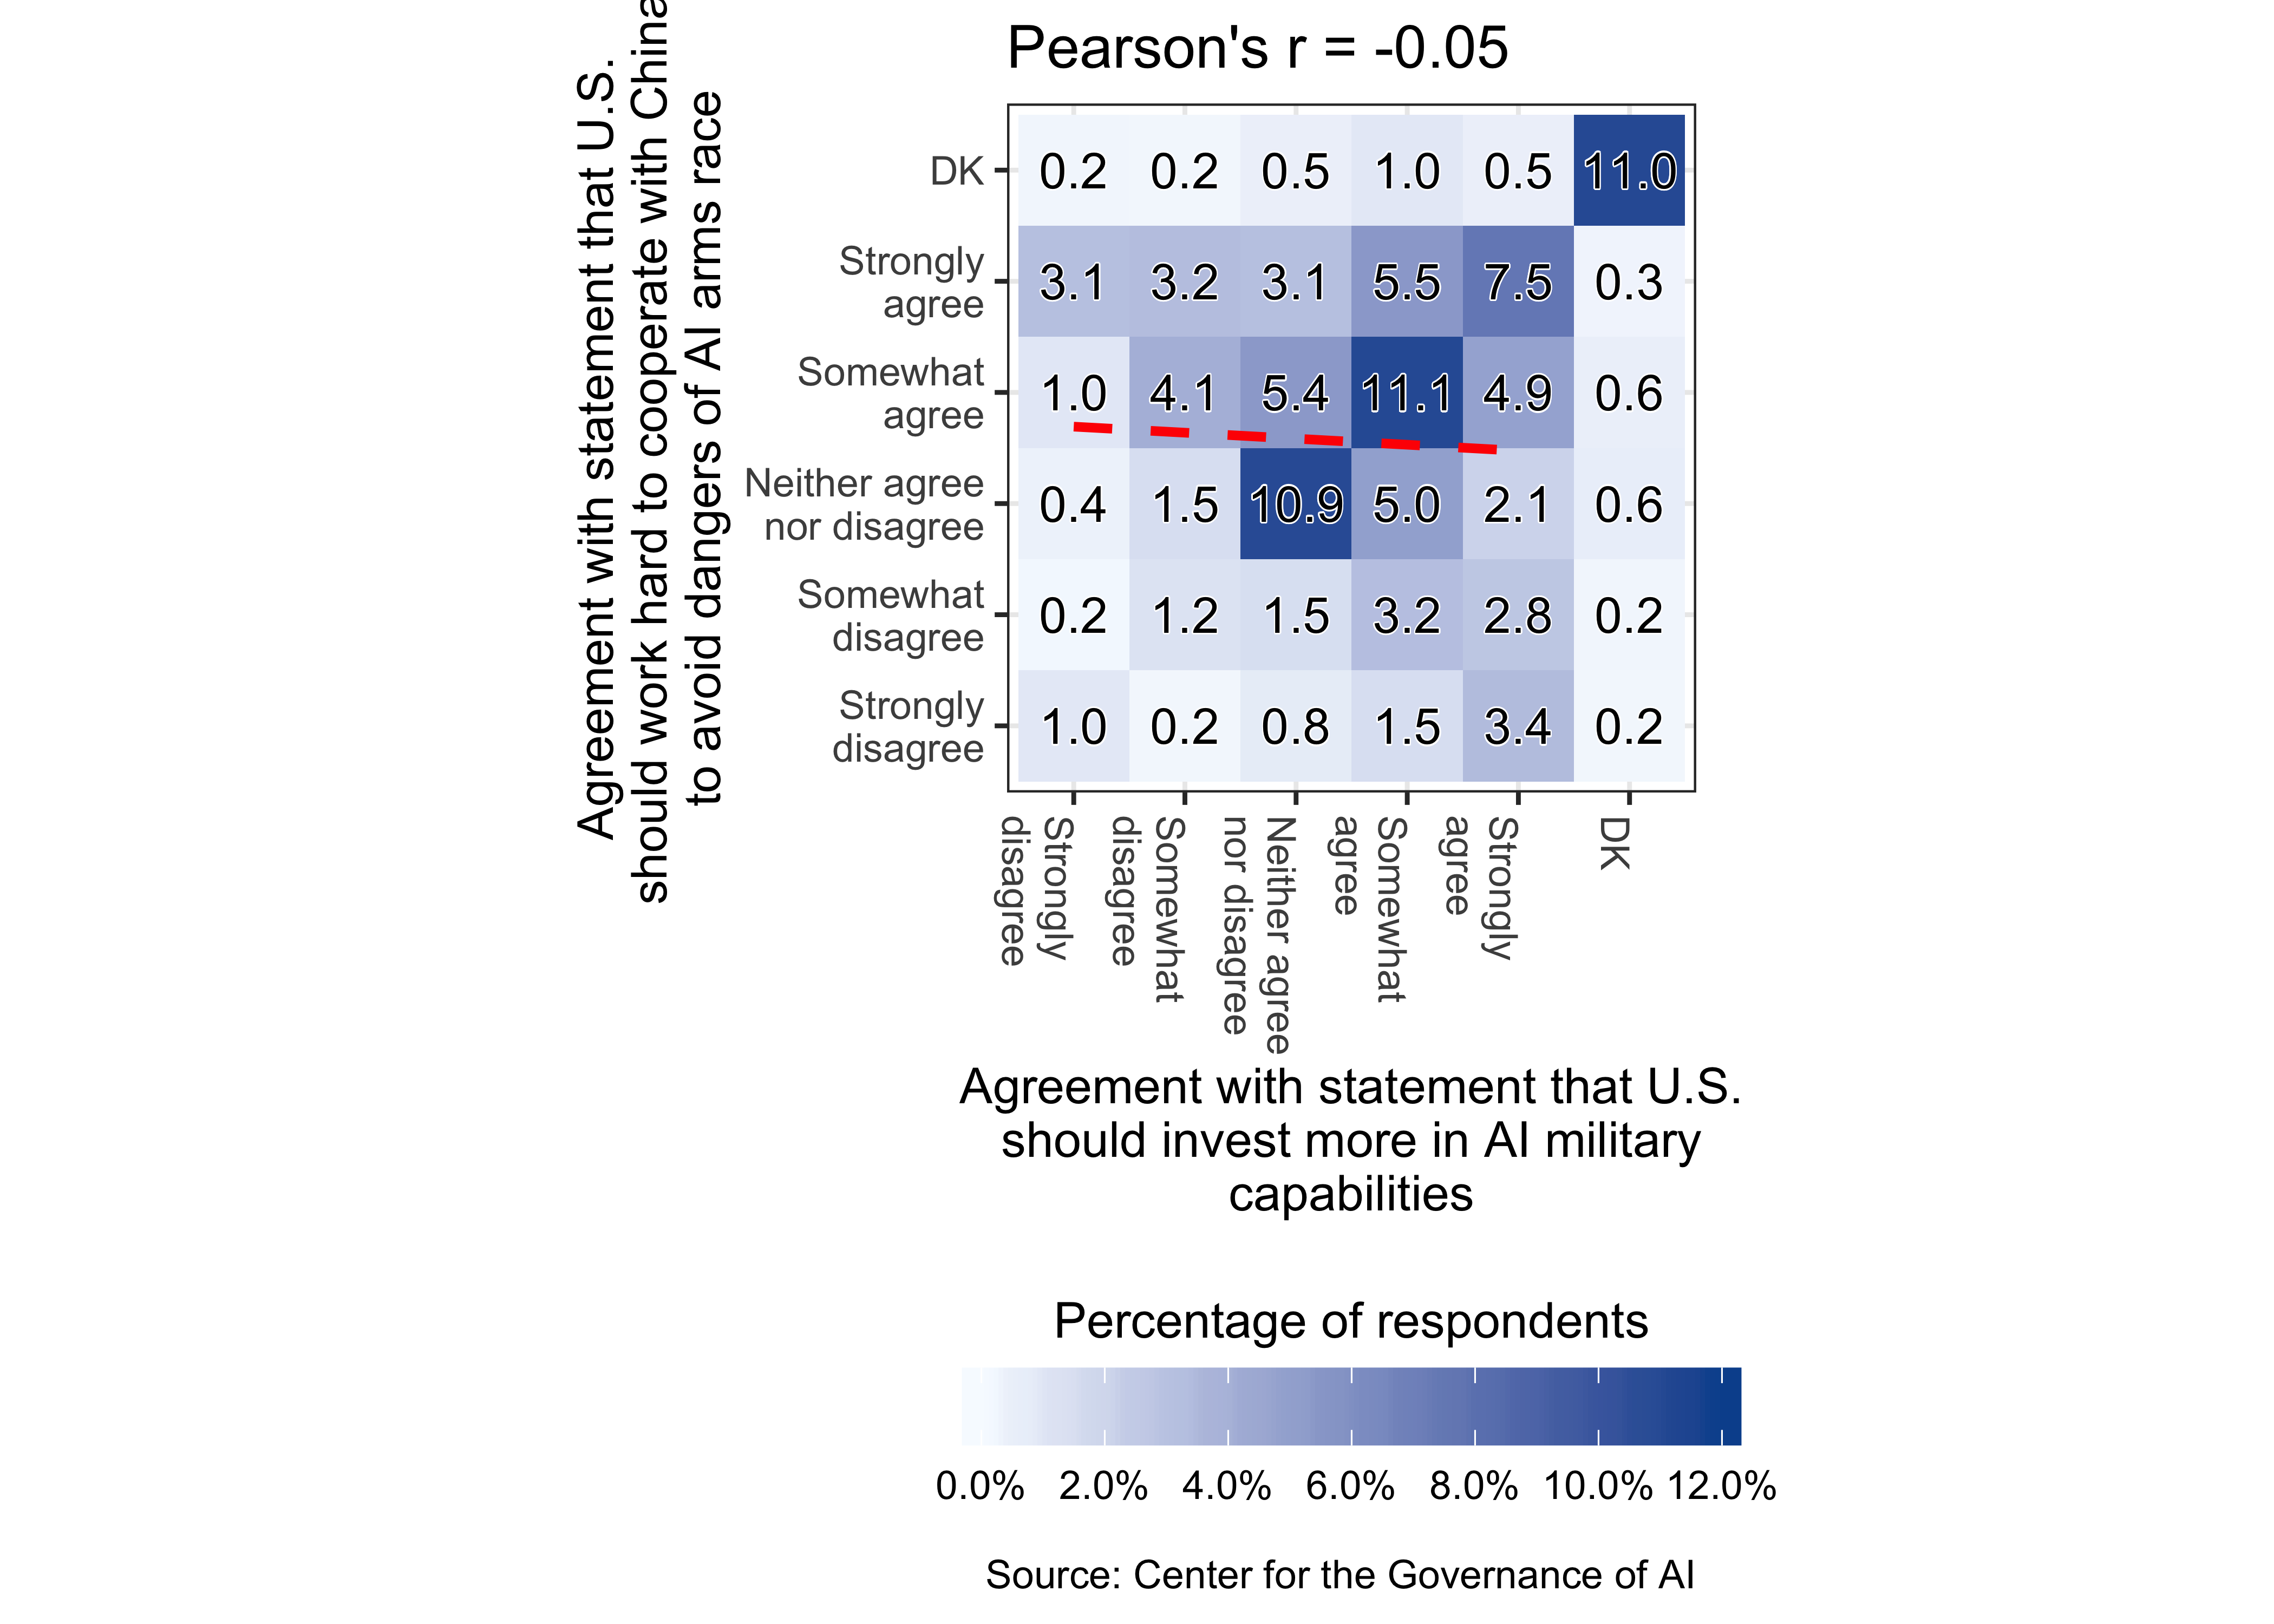
We checked that “don’t know” or missing responses to both statements are not induced by the information treatments. (See Appendix B for the survey experiment text.) Next, we examined the correlation between responses to the two statements using a 2D bin count graph. The overall Pearson correlation coefficient is -0.05 but there exists considerable variation by experimental condition.
Table C.21: Survey experiment attrition check: agreement with statement that U.S. should invest more in AI military capabilities
| Control |
13.53 |
13.53 |
0 |
| Treatment 1: Pro-nationalist |
12.28 |
12.28 |
0 |
| Treatment 2: Risks of arms race |
12.58 |
12.58 |
0 |
| Treatment 3: One common humanity |
13.62 |
13.62 |
0 |
Table C.22: Survey experiment attrition check: agreement with statement that U.S. should invest more in AI military capabilities
| (Intercept) |
0.13 (0.02)*** |
| Treatment 1: Pro-nationalist |
<0.01 (0.02) |
| Treatment 2: Risks of arms race |
-0.01 (0.02) |
| Treatment 3: One common humanity |
>-0.01 (0.02) |
| N = 2000 |
F(3, 1996) = 0.08; p-value: 0.972 |
Table C.23: Survey experiment attrition check: agreement with statement that U.S. should work hard to cooperate with China to avoid dangers of AI arms race
| Control |
14.12 |
13.92 |
0.2 |
| Treatment 1: Pro-nationalist |
14.26 |
14.26 |
0.0 |
| Treatment 2: Risks of arms race |
12.78 |
12.78 |
0.0 |
| Treatment 3: One common humanity |
12.80 |
12.80 |
0.0 |
Table C.24: Survey experiment attrition check: agreement with statement that U.S. should work hard to cooperate with China to avoid dangers of AI arms race
| (Intercept) |
0.14 (0.02)*** |
| Treatment 1: Pro-nationalist |
0.02 (0.02) |
| Treatment 2: Risks of arms race |
-0.01 (0.02) |
| Treatment 3: One common humanity |
-0.02 (0.02) |
| N = 2000 |
F(3, 1996) = 0.76; p-value: 0.516 |
Table C.25: Correlation between responses to the two statements
| Overall |
-0.05 |
| Control |
-0.06 |
| Treatment 1: Pro-nationalist |
-0.03 |
| Treatment 2: Risks of arms race |
-0.12 |
| Treatment 3: One common humanity |
-0.01 |
Trend across time: job creation or job loss
There are many “don’t know” responses to this survey question (see Appendix B for the survey question text). Nevertheless, “don’t know” or missing responses are not affected by the experimental future time framing. \(F\)-tests reveal that there are no differences in responses to the three future time frames, as seen in Table C.30.
Table C.26: Survey experiment attrition check: future time frame
| No time frame |
24.59 |
24.38 |
0.21 |
| 10 years |
25.49 |
25.49 |
0.00 |
| 20 years |
26.16 |
25.96 |
0.20 |
| 50 years |
24.17 |
24.17 |
0.00 |
Table C.27: Survey experiment attrition check: future time frame
| (Intercept) |
0.25 (0.02)*** |
| 10 years |
0.01 (0.03) |
| 20 years |
0.02 (0.03) |
| 50 years |
-0.01 (0.03) |
| N = 2000 |
F(3, 1996) = 0.34; p-value: 0.795 |
Table C.28: Survey experiment results: future time frame
| (Intercept) |
-0.52 (0.06)*** |
| 10 years |
-0.15 (0.08) |
| 20 years |
-0.12 (0.08) |
| 50 years |
-0.06 (0.08) |
| N = 2000 |
F(3, 1996) = 1.48; p-value: 0.219 |
Table C.29: Survey experiment results: future time frame (controlling for DK/missing responses)
| (Intercept) |
-0.52 (0.06)*** |
| 10 years |
-0.15 (0.08) |
| 20 years |
-0.12 (0.08) |
| 50 years |
-0.06 (0.08) |
| N = 2000 |
F(7, 1992) = 1.68; p-value: 0.108 |
Table C.30: Testing coefficients for time frames are equivalent
| 10 years = 20 years |
F(1, 1992) = 0.15 |
0.70 |
| 10 years = 50 years |
F(1, 1992) = 1.41 |
0.24 |
| 20 years = 50 years |
F(1, 1992) = 0.63 |
0.43 |
High-level machine intelligence: forecasting timeline
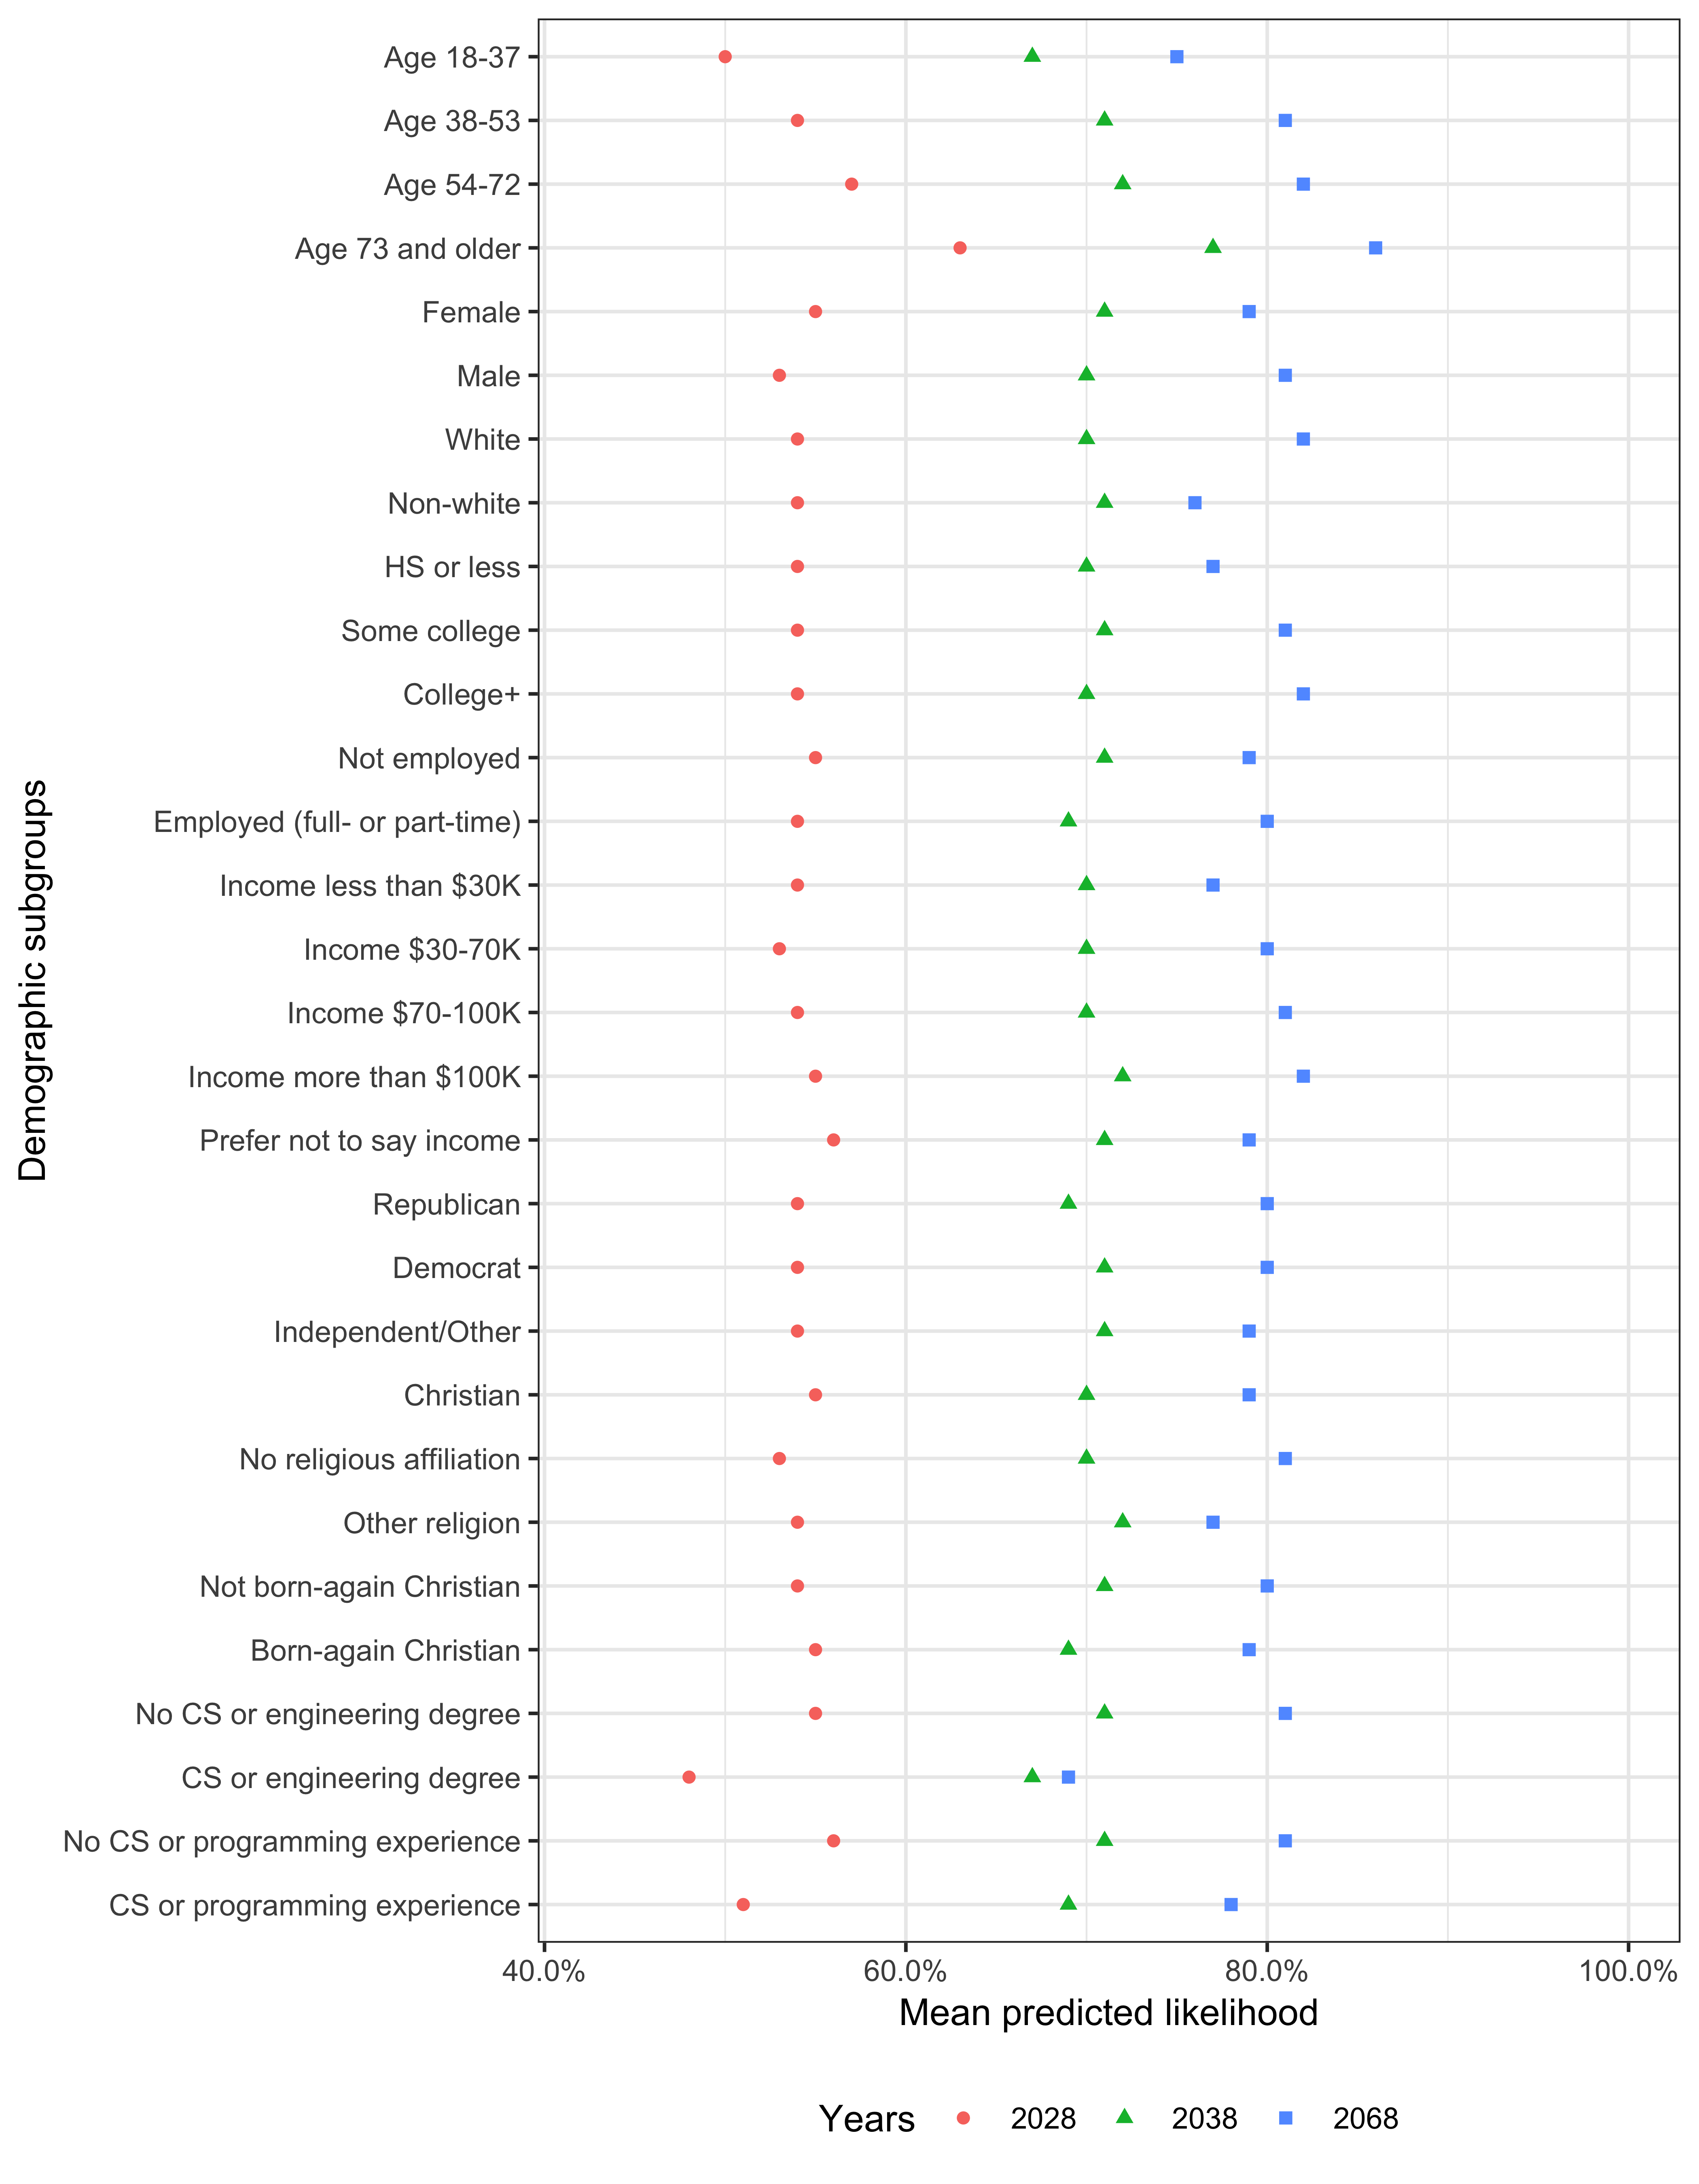
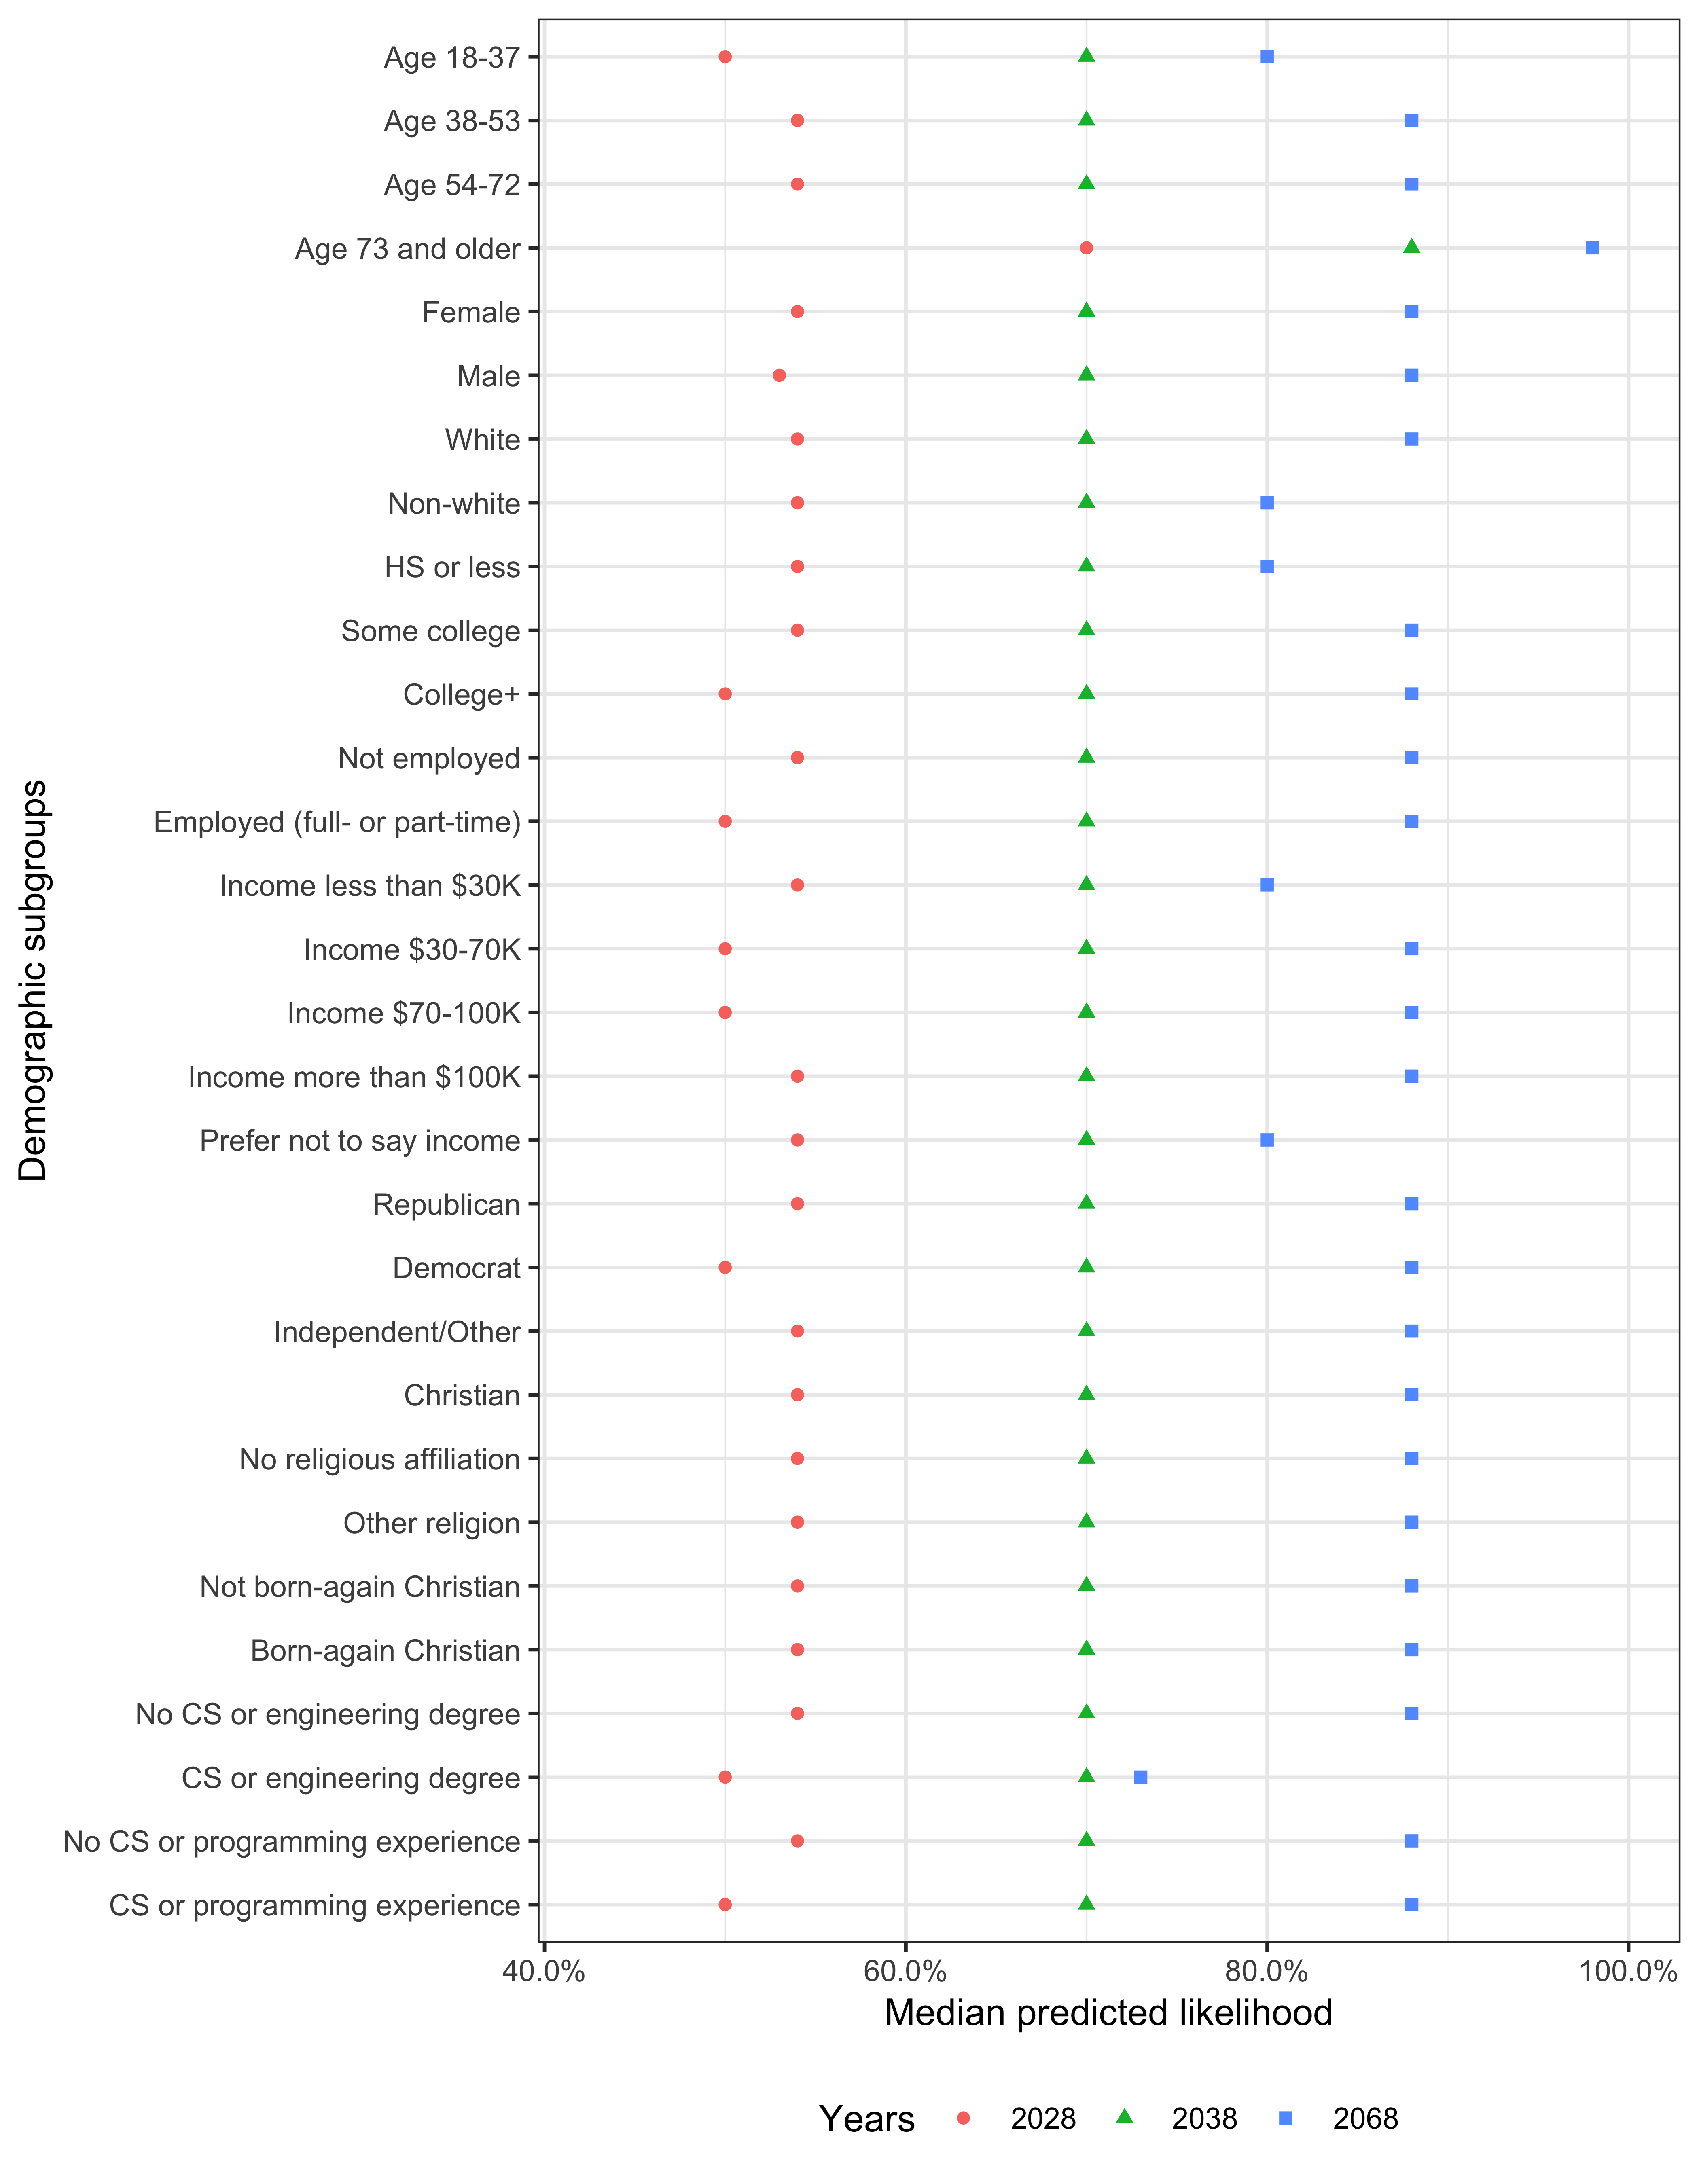
Figure C.3 displays the mean predicted the likelihood of high-level machine intelligence for each year by demographic subgroup. Figure C.4 displays the median predicted probability of high-level machine intelligence for each year by demographic subgroup.
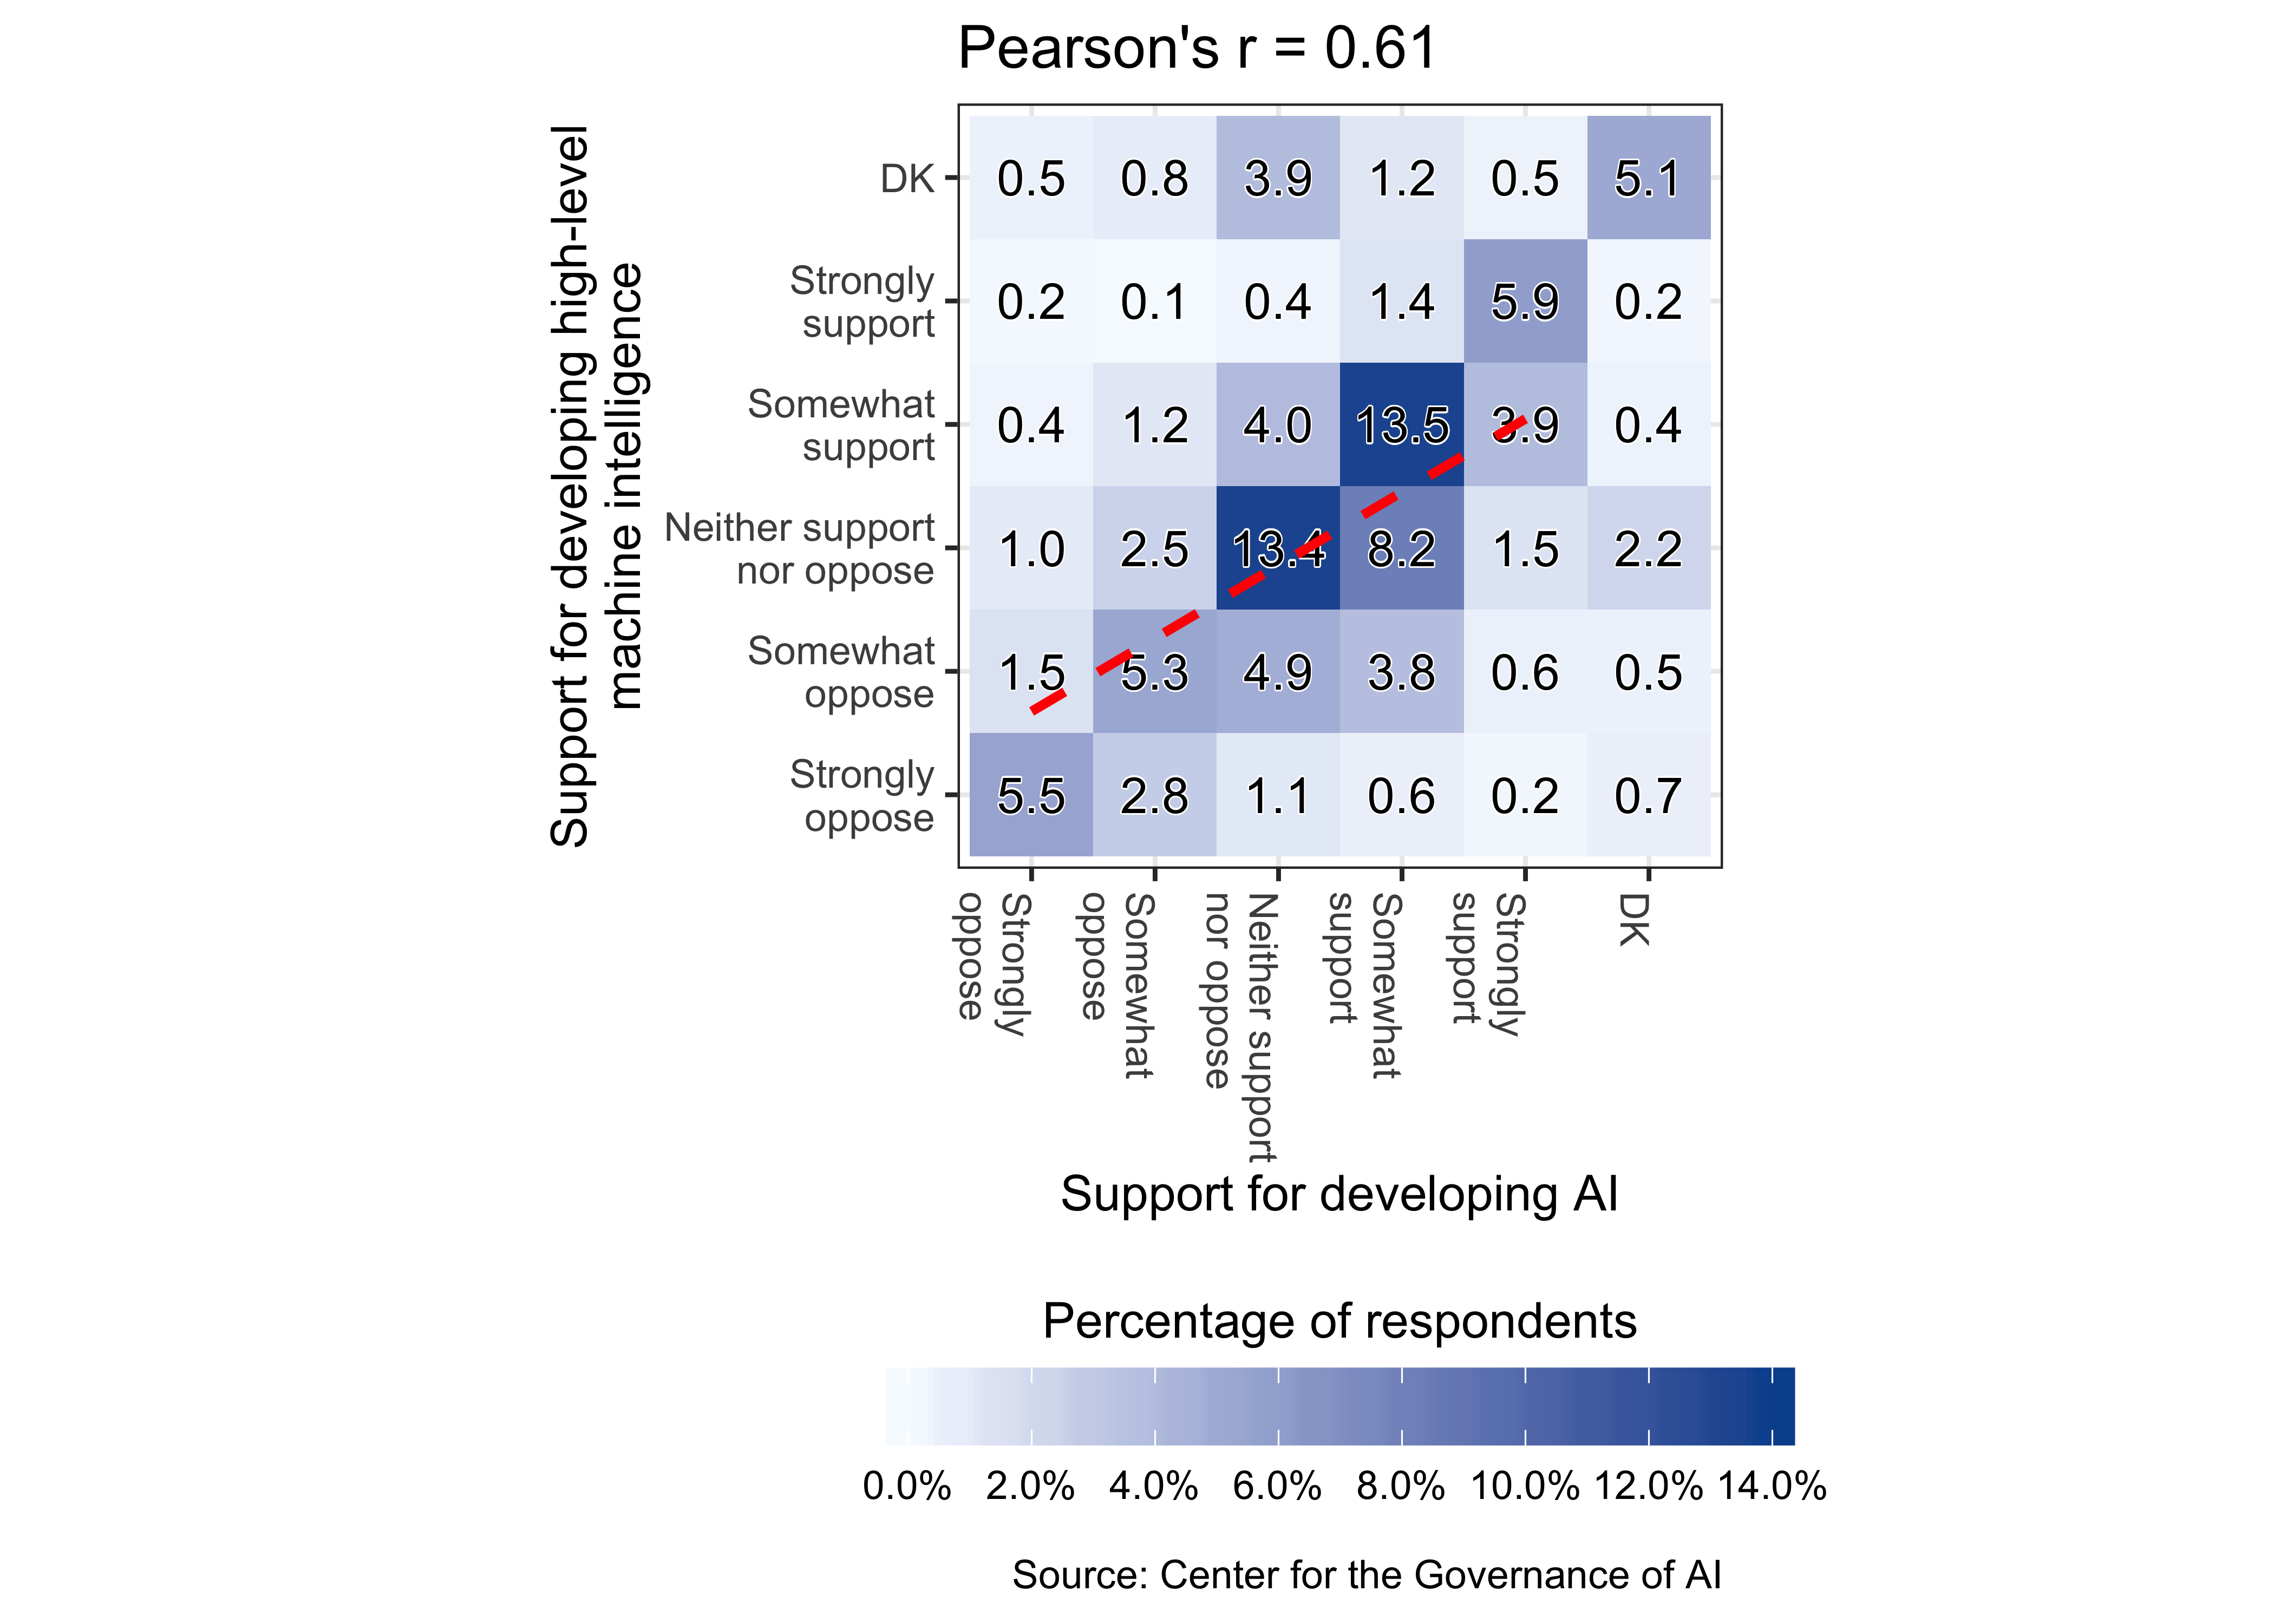
Support for developing high-level machine intelligence
We examined the correlation between support for developing AI and support for developing high-level machine intelligence using a 2D bin count graph. The overall Pearson correlation coefficient is 0.61, according to Figure C.5.
The mean level of support for developing high-level machine intelligence, compared with the mean level of support for developing AI, is 0.24 points (MOE = +/- 0.04) lower on a five-point scale (two-sided \(p\)-value \(<0.001\)), as shown in Table C.31.
Table C.32 displays the regression results used to produce Figure 6.5.
To identify subgroups that have diverging attitudes toward high-level machine intelligence versus AI, we performed multiple regression using both the demographic subgroups variables and respondents’ support for developing AI as predictors. The support for developing high-level machine intelligence outcome variable was standardized such that it has mean 0 and unit variance. The results are shown in Table C.33.
After controlling for one’s support for developing AI, significant predictors correlated with support for developing high level machine intelligence, including:
- Being a member of the Silent Generation (versus being a Millennial/post-Millennial)
- Having CS or programming experience (versus not having such experience)
- Having a high school degree or less (versus having at least a four-year college degree)
Table C.31: Difference between support for developing AI and support for developing high-level machine intelligence
| (Intercept) |
0.25 (0.03)*** |
| High-level machine intelligence |
-0.24 (0.02)*** |
| N = 2000 |
|
Table C.32: Predicting support for developing high-level machine intelligence using demographic characteristics: results from a multiple linear regression that includes all demographic variables; outcome standardized to have mean 0 and unit variance
| (Intercept) |
-0.25 (0.09)** |
| Age 38-53 |
-0.12 (0.06) |
| Age 54-72 |
-0.03 (0.06) |
| Age 73 and older |
0.12 (0.10) |
| Male |
0.18 (0.05)*** |
| Non-white |
0.01 (0.05) |
| Some college |
-0.04 (0.06) |
| College+ |
<0.01 (0.07) |
| Employed (full- or part-time) |
0.09 (0.05) |
| Democrat |
0.11 (0.07) |
| Independent/Other |
-0.13 (0.07)* |
| Income $30-70K |
-0.01 (0.07) |
| Income $70-100K |
0.09 (0.09) |
| Income more than $100K |
0.19 (0.09)* |
| Prefer not to say income |
<0.01 (0.08) |
| No religious affiliation |
0.09 (0.06) |
| Other religion |
0.06 (0.08) |
| Born-again Christian |
-0.07 (0.06) |
| CS or engineering degree |
<0.01 (0.10) |
| CS or programming experience |
0.36 (0.06)*** |
| N = 2000 |
F(19,1980) = 7.27; p-value: <0.001 |
Table C.33: Predicting support for developing high-level machine intelligence using demographic characteristics: results from a multiple linear regression that includes all demographic variables and respondents’ support for developing AI; outcome standardized to have mean 0 and unit variance
| (Intercept) |
-0.23 (0.08)** |
| Age 38-53 |
-0.02 (0.05) |
| Age 54-72 |
0.09 (0.05) |
| Age 73 and older |
0.22 (0.09)* |
| Male |
0.08 (0.04) |
| Non-white |
0.02 (0.05) |
| Some college |
-0.04 (0.05) |
| College+ |
-0.11 (0.06) |
| Employed (full- or part-time) |
0.08 (0.04) |
| Democrat |
-0.02 (0.06) |
| Independent/Other |
-0.10 (0.05) |
| Income $30-70K |
-0.01 (0.06) |
| Income $70-100K |
0.01 (0.07) |
| Income more than $100K |
0.08 (0.07) |
| Prefer not to say income |
0.09 (0.07) |
| No religious affiliation |
-0.02 (0.05) |
| Other religion |
-0.03 (0.07) |
| Born-again Christian |
-0.05 (0.05) |
| CS or engineering degree |
-0.03 (0.07) |
| CS or programming experience |
0.17 (0.05)*** |
| Support for developing AI |
0.58 (0.02)*** |
| N = 2000 |
F(20,1979) = 54.15; p-value: <0.001 |
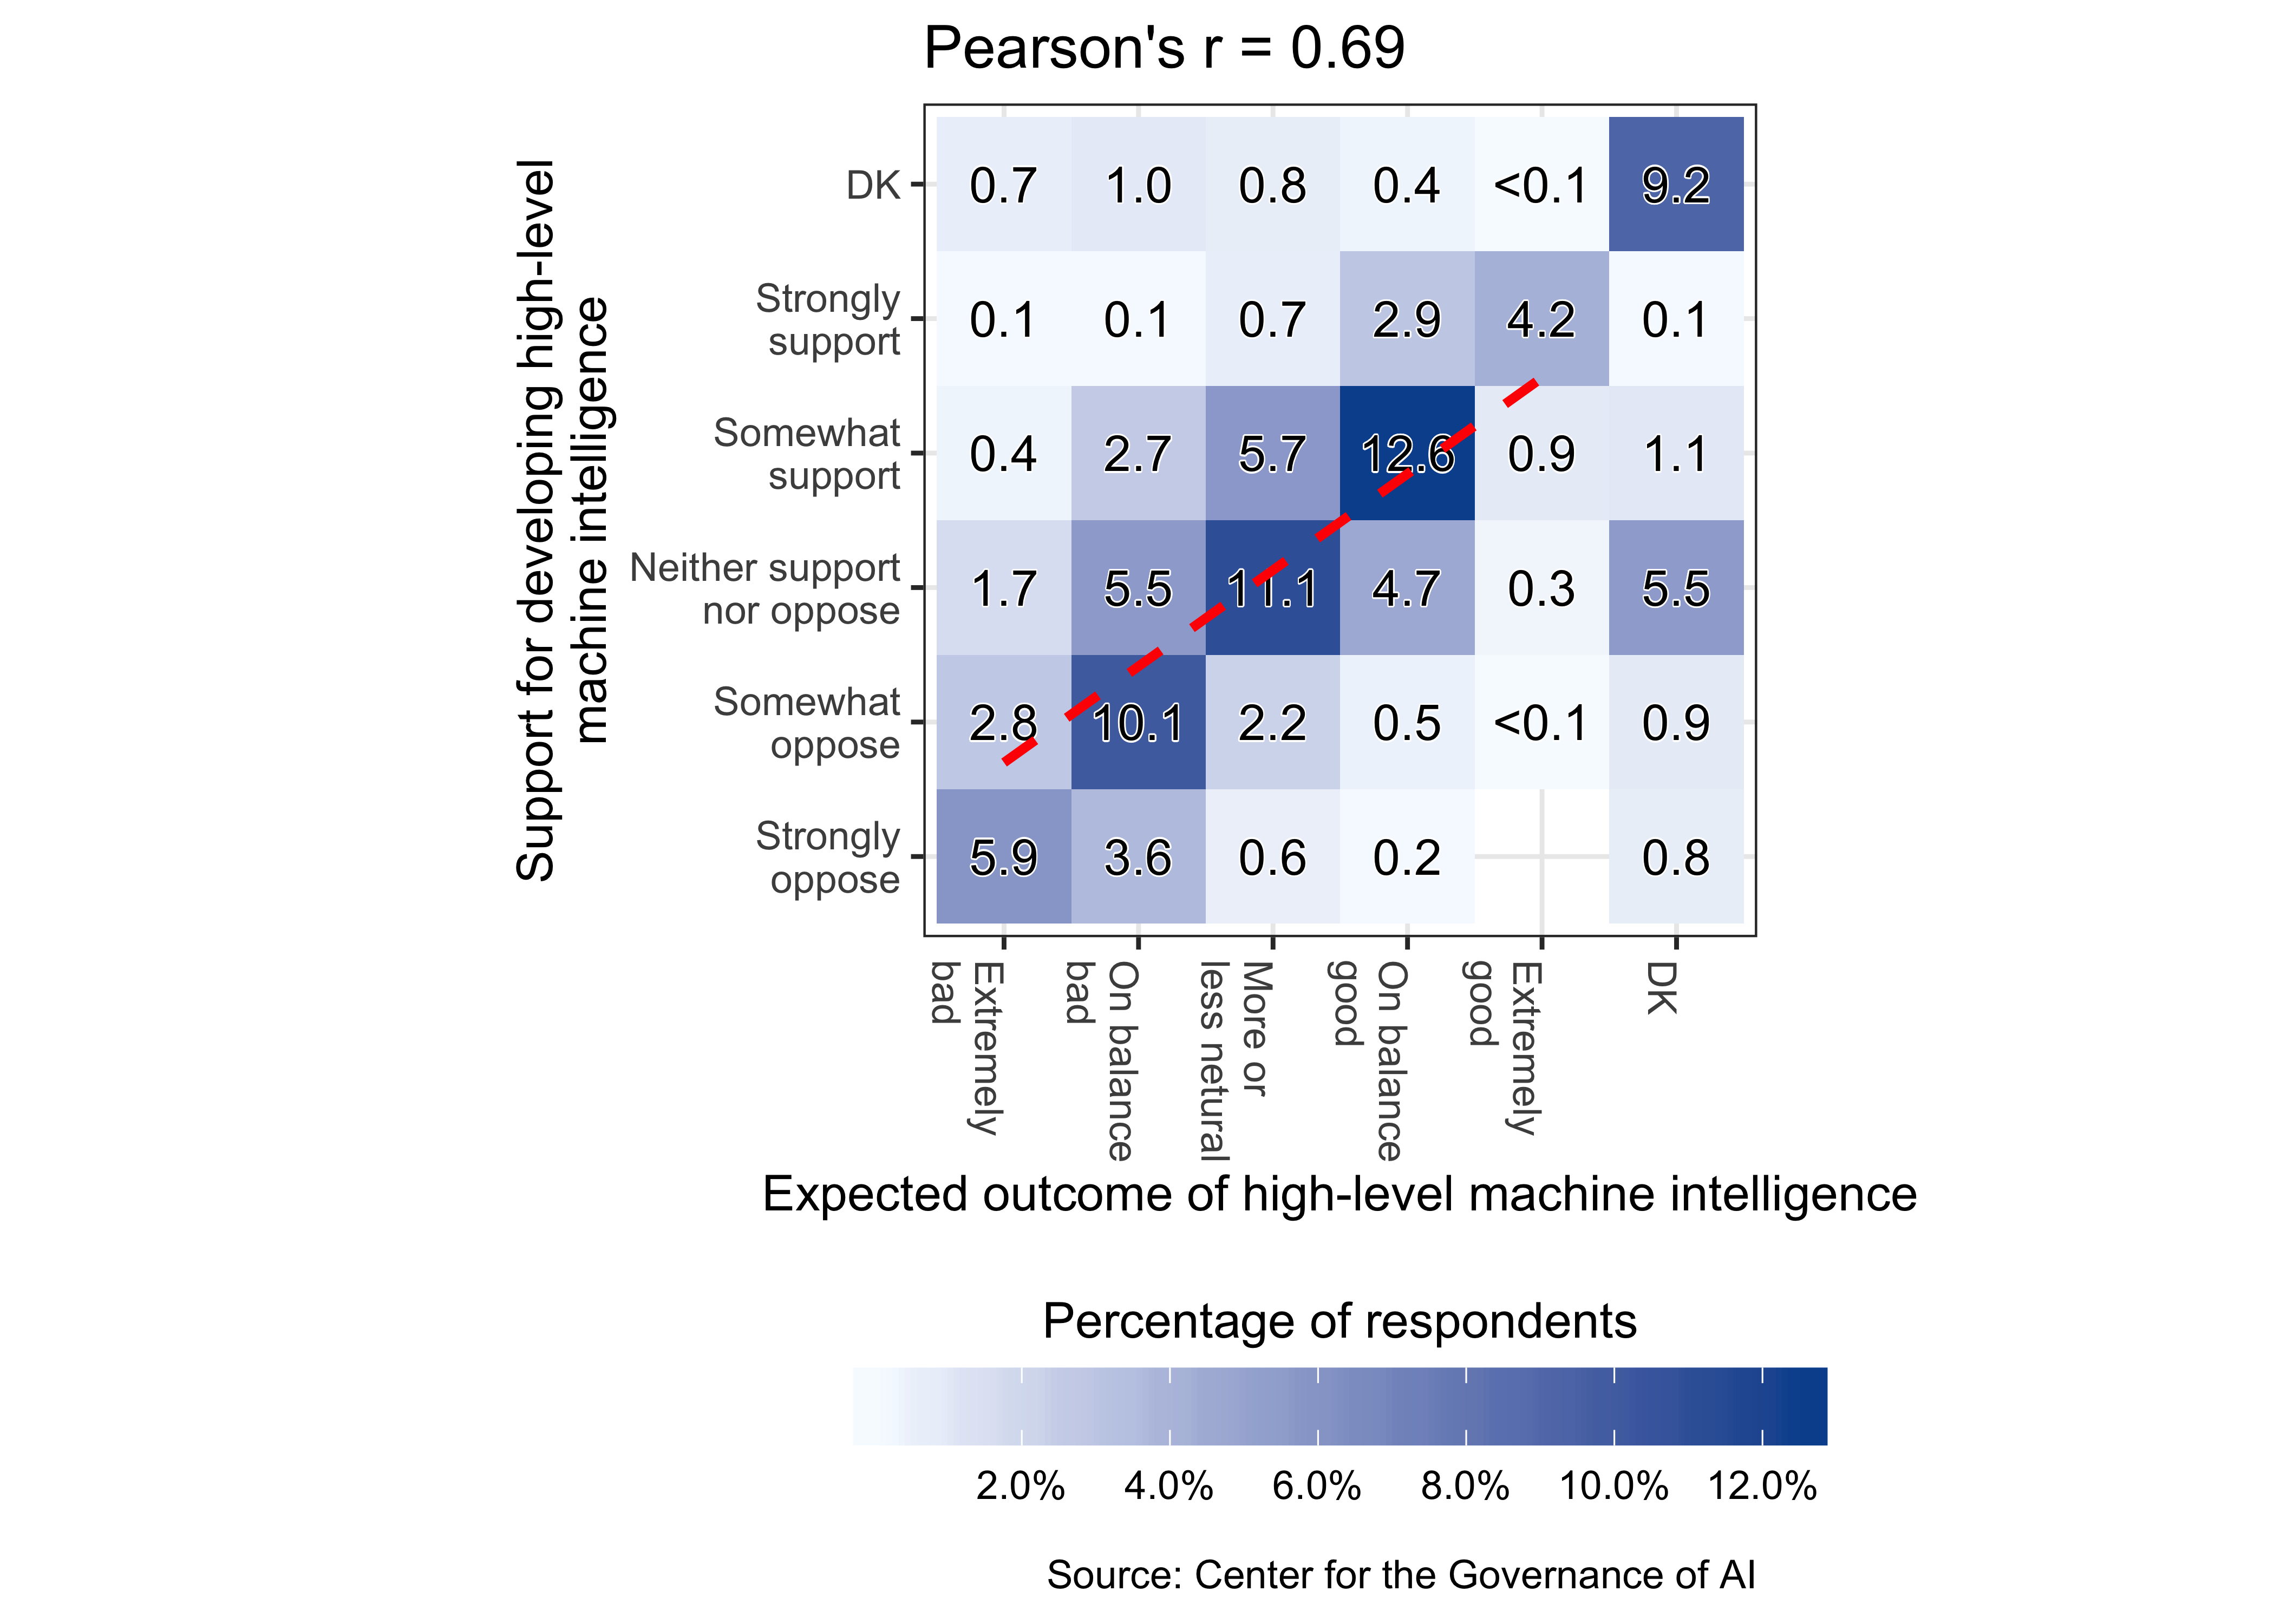
Expected outcome of high-level machine intelligence
We examined the correlation between respondents’ expected outcome of high-level machine intelligence and support for developing high-level machine intelligence using a 2D bin count graph. The overall Pearson correlation coefficient is 0.69, as seen in Figure C.6.