2 General attitudes toward AI
2.1 More Americans support than oppose developing AI
We measured respondents’ support for the further development of AI after providing them with basic information about the technology. Respondents were given the following definition of AI:
Artificial Intelligence (AI) refers to computer systems that perform tasks or make decisions that usually require human intelligence. AI can perform these tasks or make these decisions without explicit human instructions. Today, AI has been used in the following applications: [five randomly selected applications]
Each respondent viewed five applications randomly selected from a list of 14 that included translation, image classification, and disease diagnosis. Afterward, respondents were asked how much they support or oppose the development of AI. (See Appendix B for the list of the 14 applications and the survey question.)
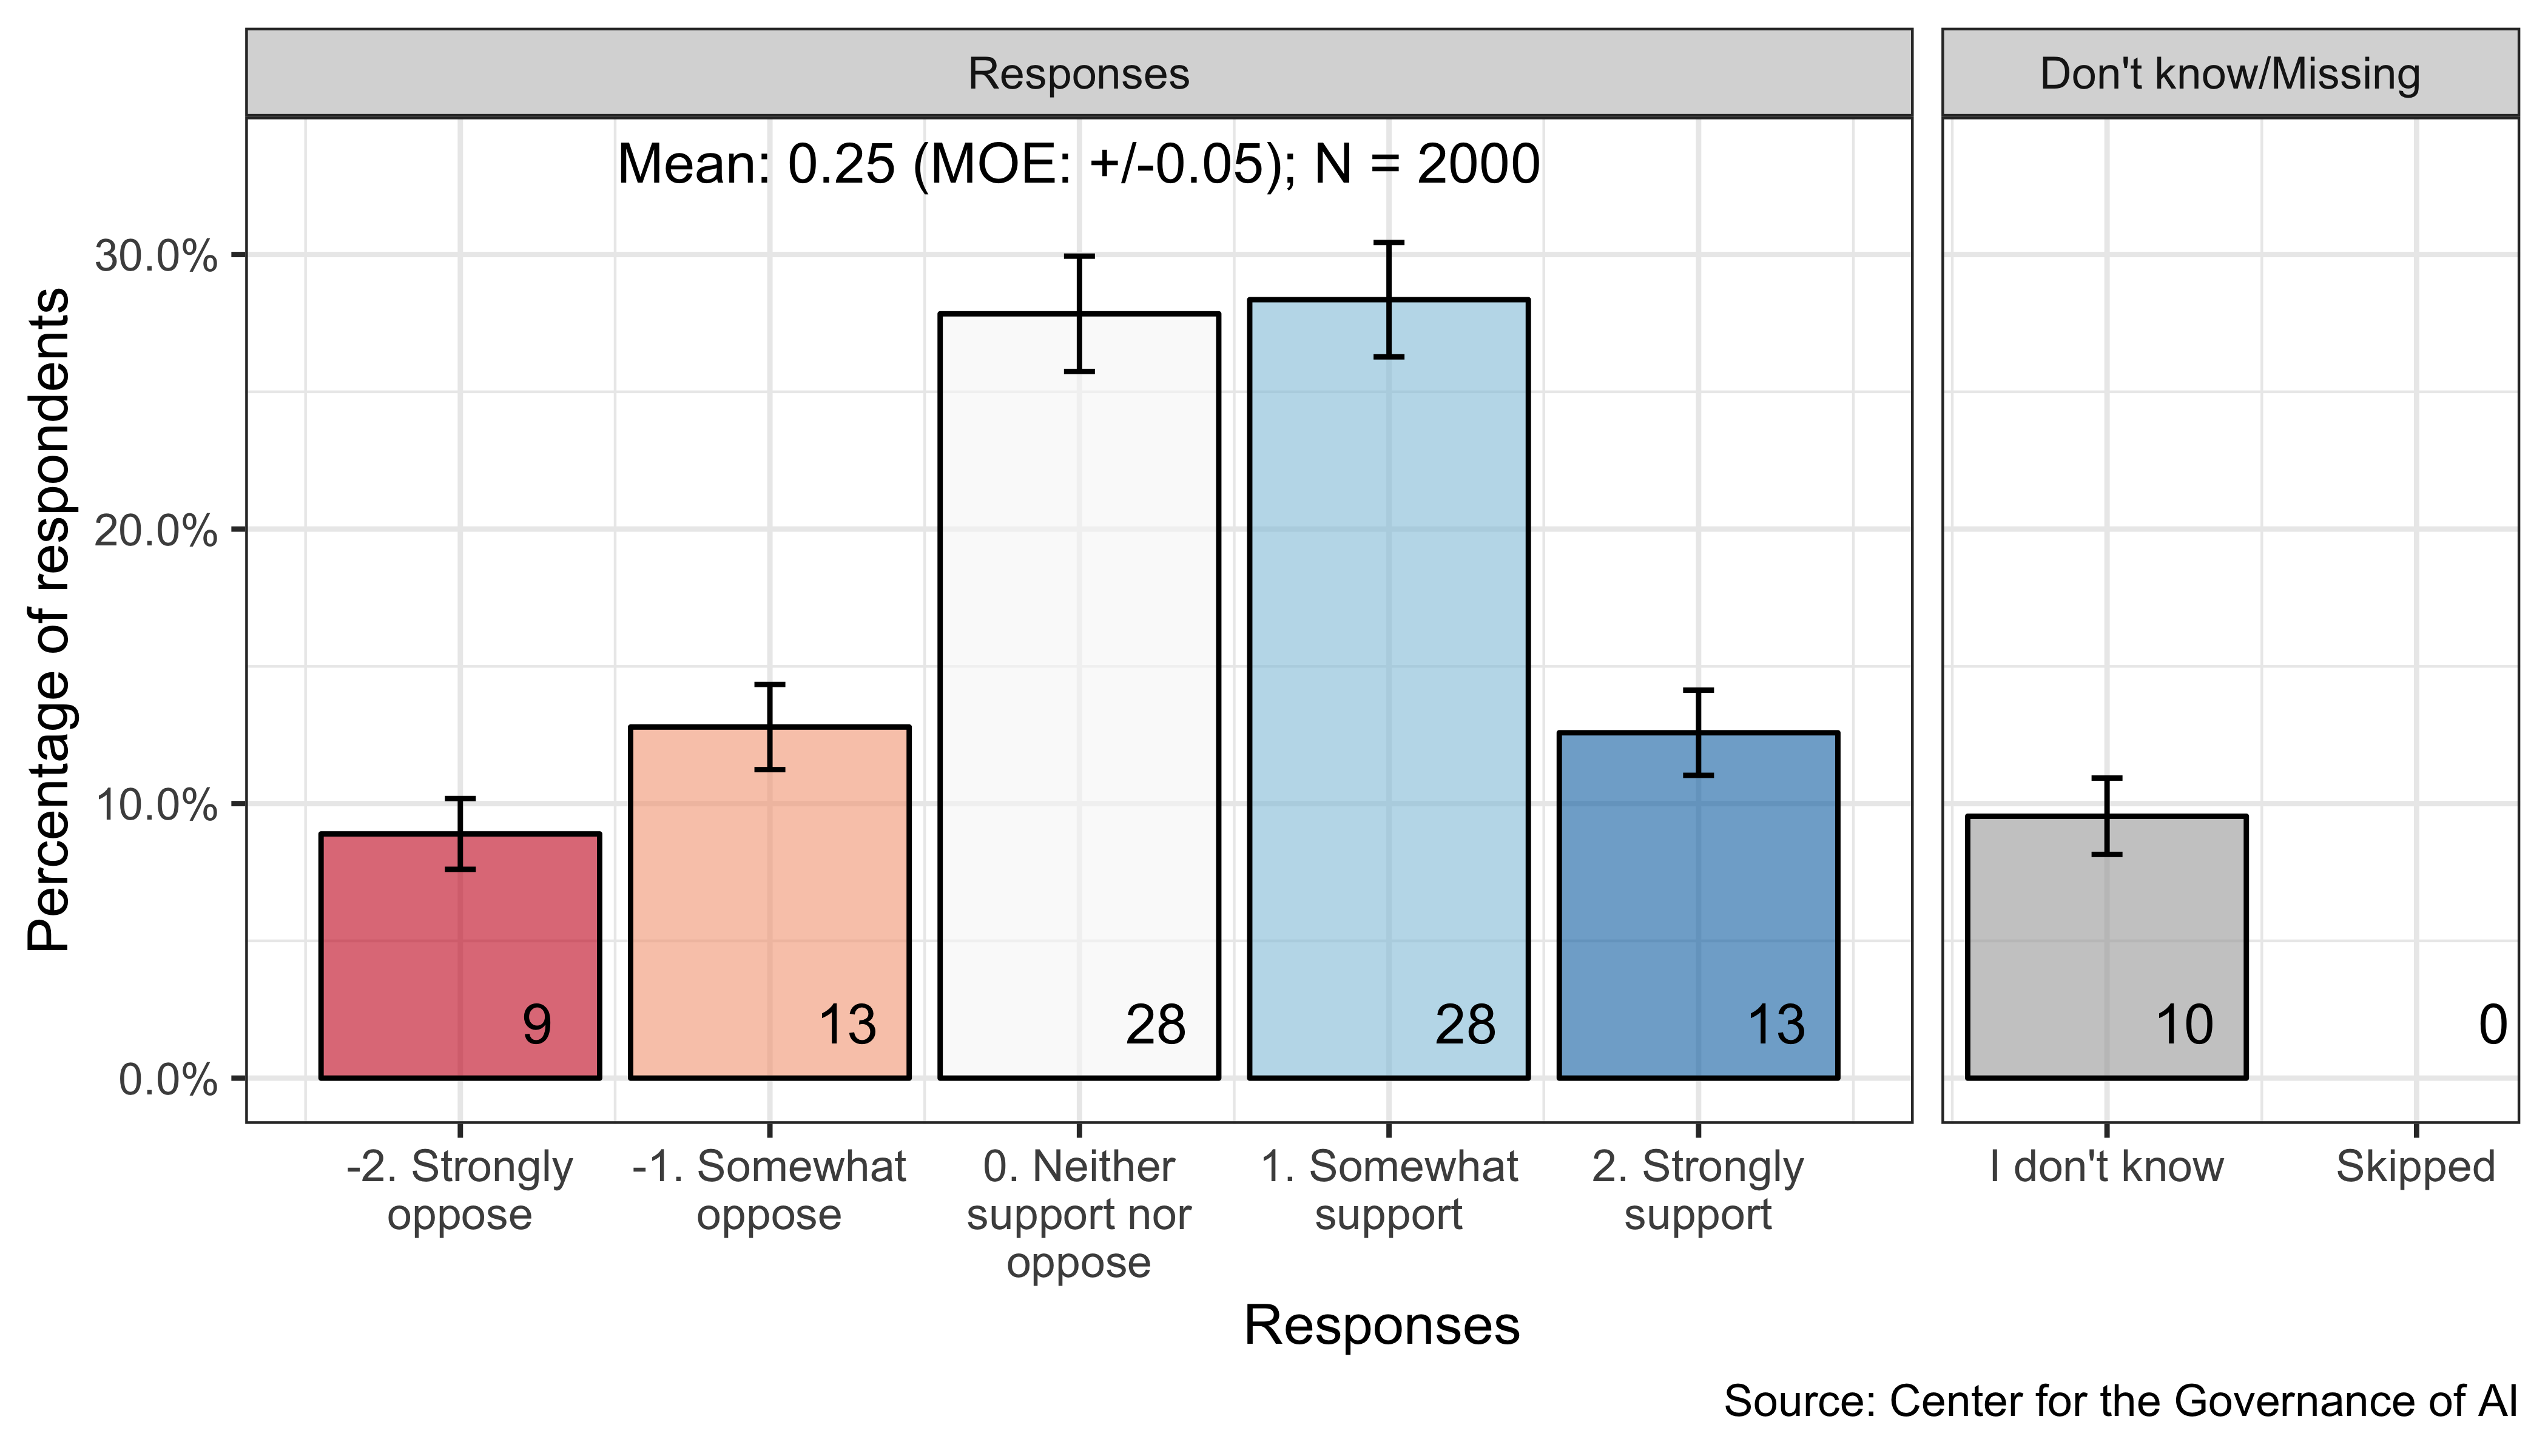
Figure 2.1: Support for developing AI
Americans express mixed support for the development of AI, although more support than oppose the development of AI, as shown in Figure 2.1. A substantial minority (41%) somewhat or strongly supports the development of AI. A smaller minority (22%) somewhat or strongly oppose its development. Many express a neutral attitude: 28% of respondents state that they neither support nor oppose while 10% indicate they do not know.
Our survey results reflect the cautious optimism that Americans express in other polls. In a recent survey, 51% of Americans indicated that they support continuing AI research while 31% opposed it (Morning Consult 2017). Furthermore, 77% of Americans expressed that AI would have a “very positive” or “mostly positive” impact on how people work and live in the next 10 years, while 23% thought that AI’s impact would be “very negative” or “mostly negative” (Northeastern University and Gallup 2018).
2.2 Support for developing AI is greater among those who are wealthy, educated, male, or have experience with technology
We examined support for developing AI by 11 demographic subgroup variables, including age, gender, race, and education. (See Appendix A for descriptions of the demographic subgroups.) We performed a multiple linear regression to predict support for developing AI using all these demographic variables.
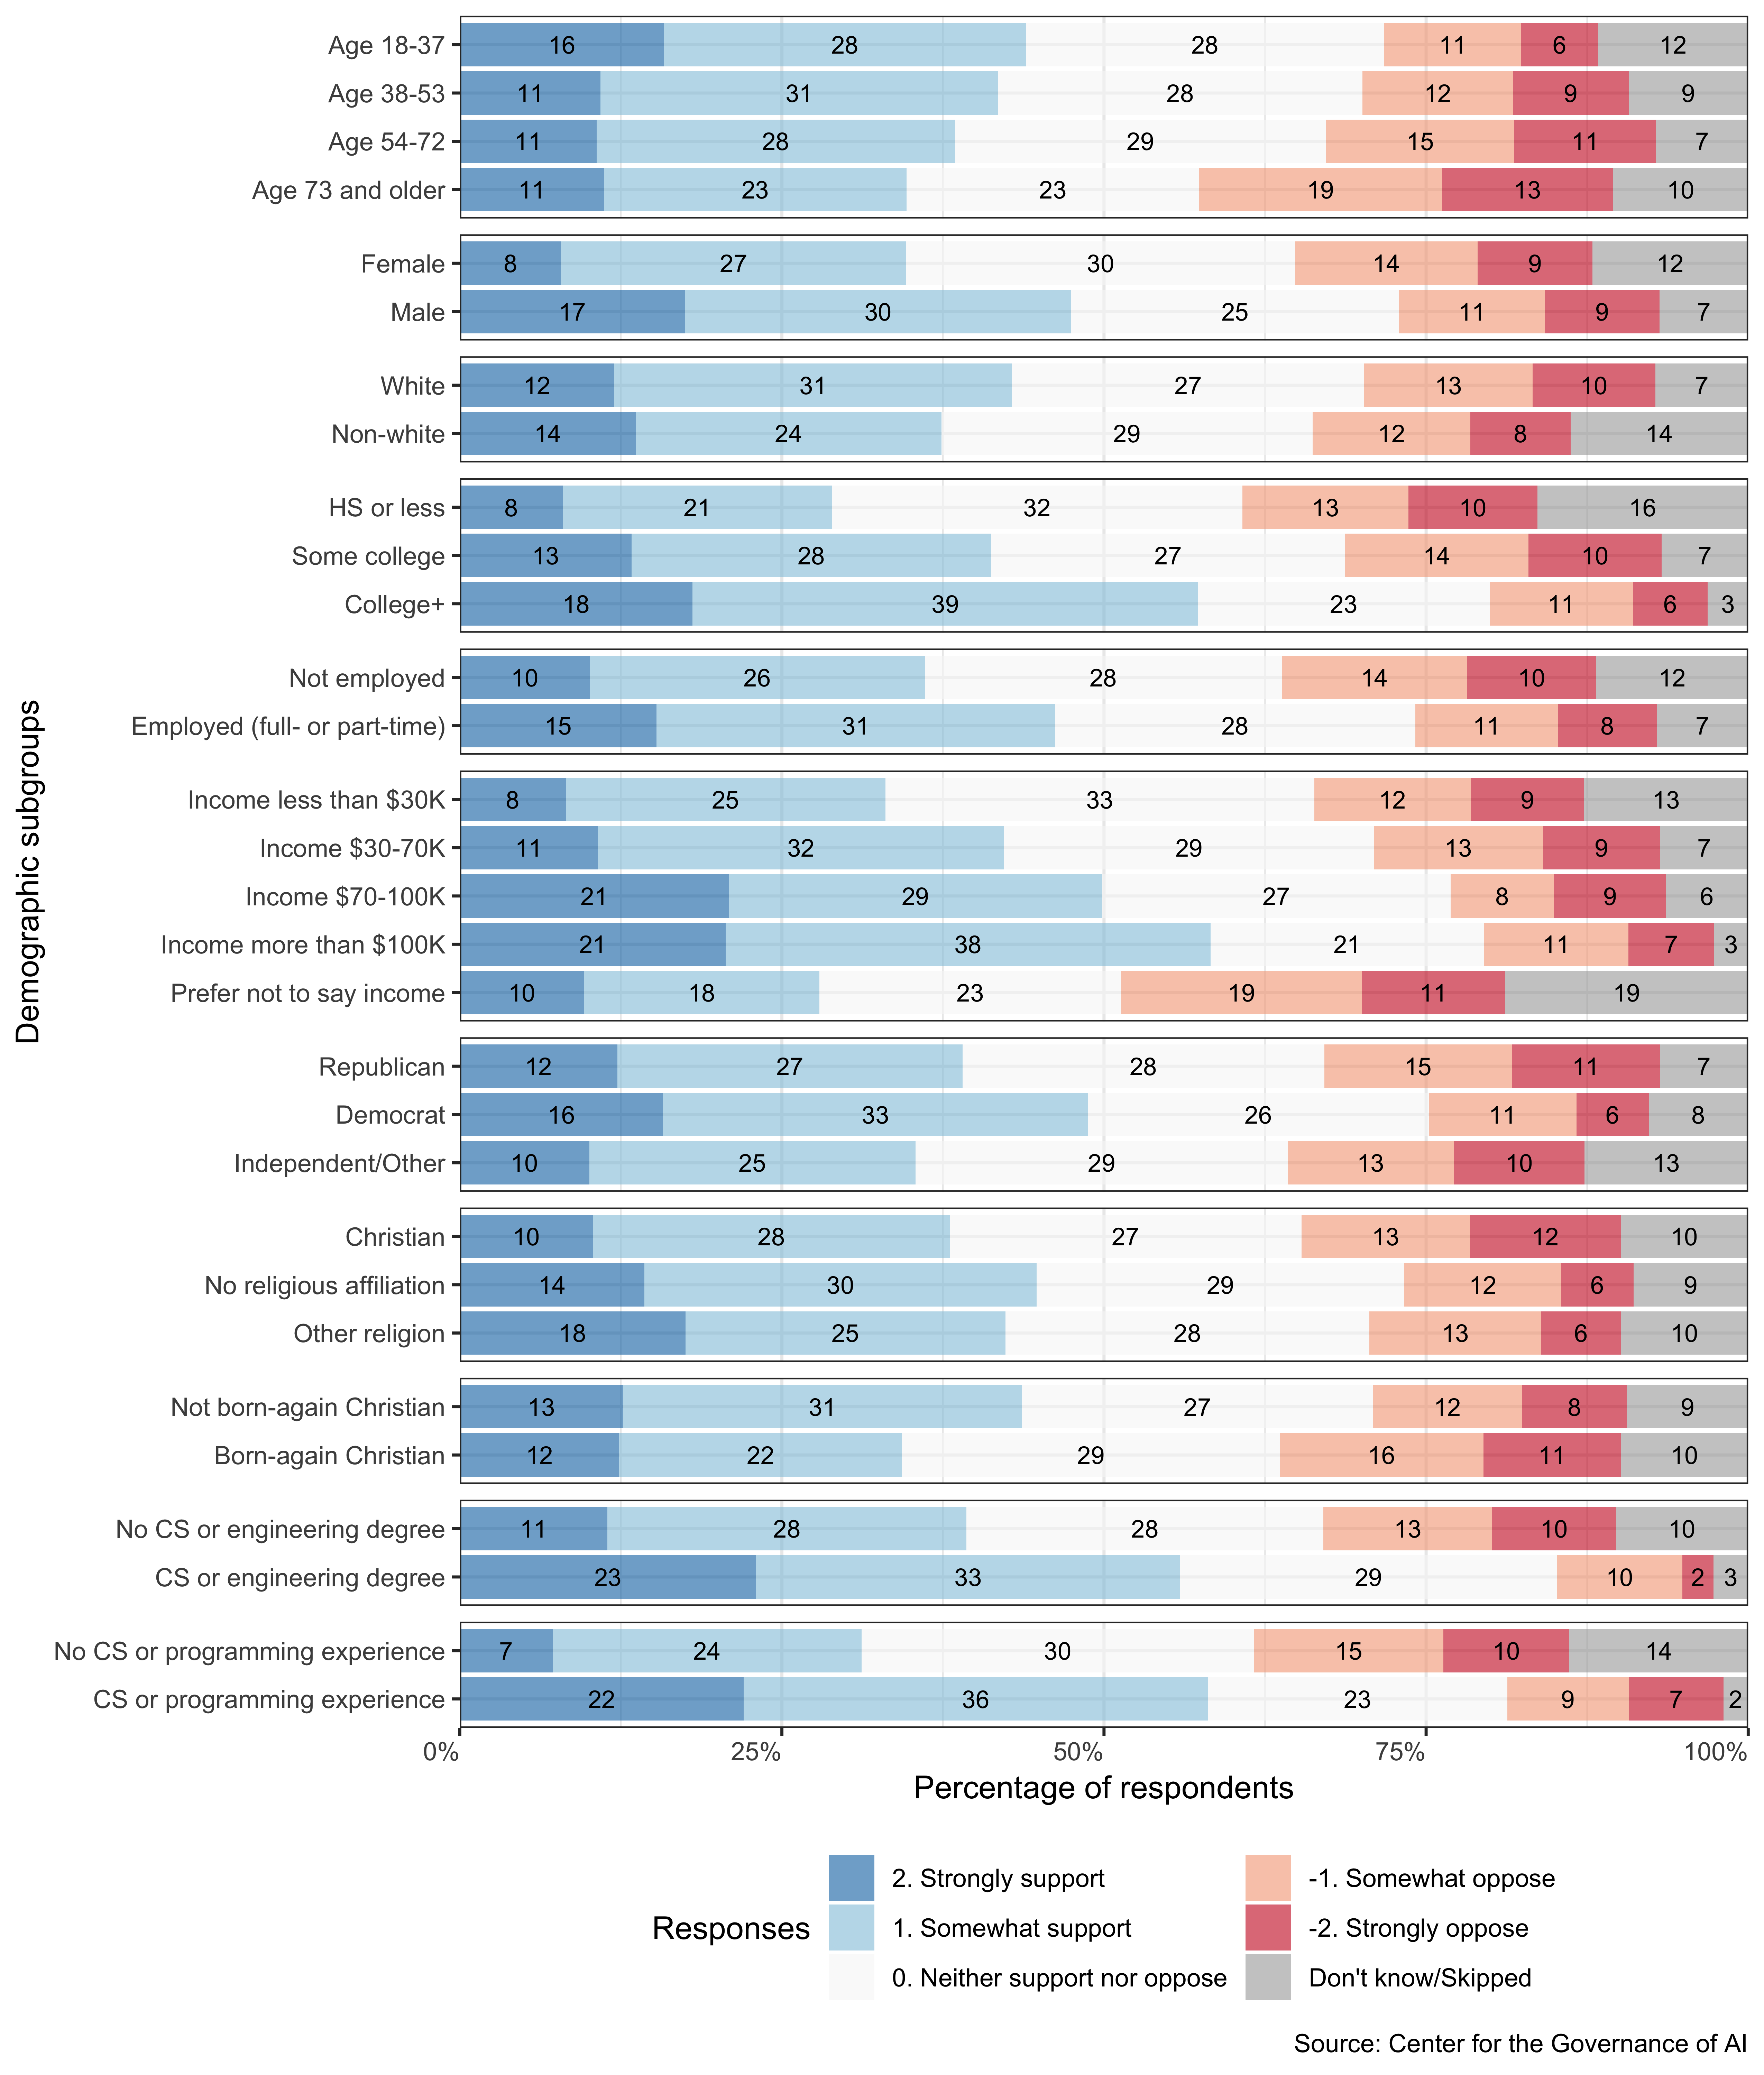
Figure 2.2: Support for developing AI across demographic characteristics: distribution of responses
Support for developing AI varies greatly between demographic subgroups, with gender, education, income, and experience being key predictors. As seen in Figure 2.2, a majority of respondents in each of the following four subgroups express support for developing AI: those with four-year college degrees (57%), those with an annual household income above $100,000 (59%), those who have completed a computer science or engineering degree (56%), and those with computer science or programming experience (58%). In contrast, women (35%), those with a high school degree or less (29%), and those with an annual household income below $30,000 (33%), are much less enthusiastic about developing AI. One possible explanation for these results is that subgroups that are more vulnerable to workplace automation express less enthusiasm for developing AI. Within developed countries, women, those with low levels of education, and low-income workers have jobs that are at higher risk of automation, according to an analysis by the Organisation for Economic Co-operation and Development (Nedelkoska and Quintini 2018).
We used a multiple regression that includes all of the demographic variables to predict support for developing AI. The support for developing AI outcome variable was standardized, such that it has mean 0 and unit variance.
Significant predictors of support for developing AI include:
- Being a Millennial/post-Millennial (versus being a Gen Xer or Baby Boomer)
- Being a male (versus being a female)
- Having graduated from a four-year college (versus having a high school degree or less)
- Identifying as a Democrat (versus identifying as a Republican)
- Having a family income of more than $100,000 annually (versus having a family income of less than $30,000 annually)
- Not having a religious affiliation (versus identifying as a Christian)
- Having CS or programming experience (versus not having such experience)
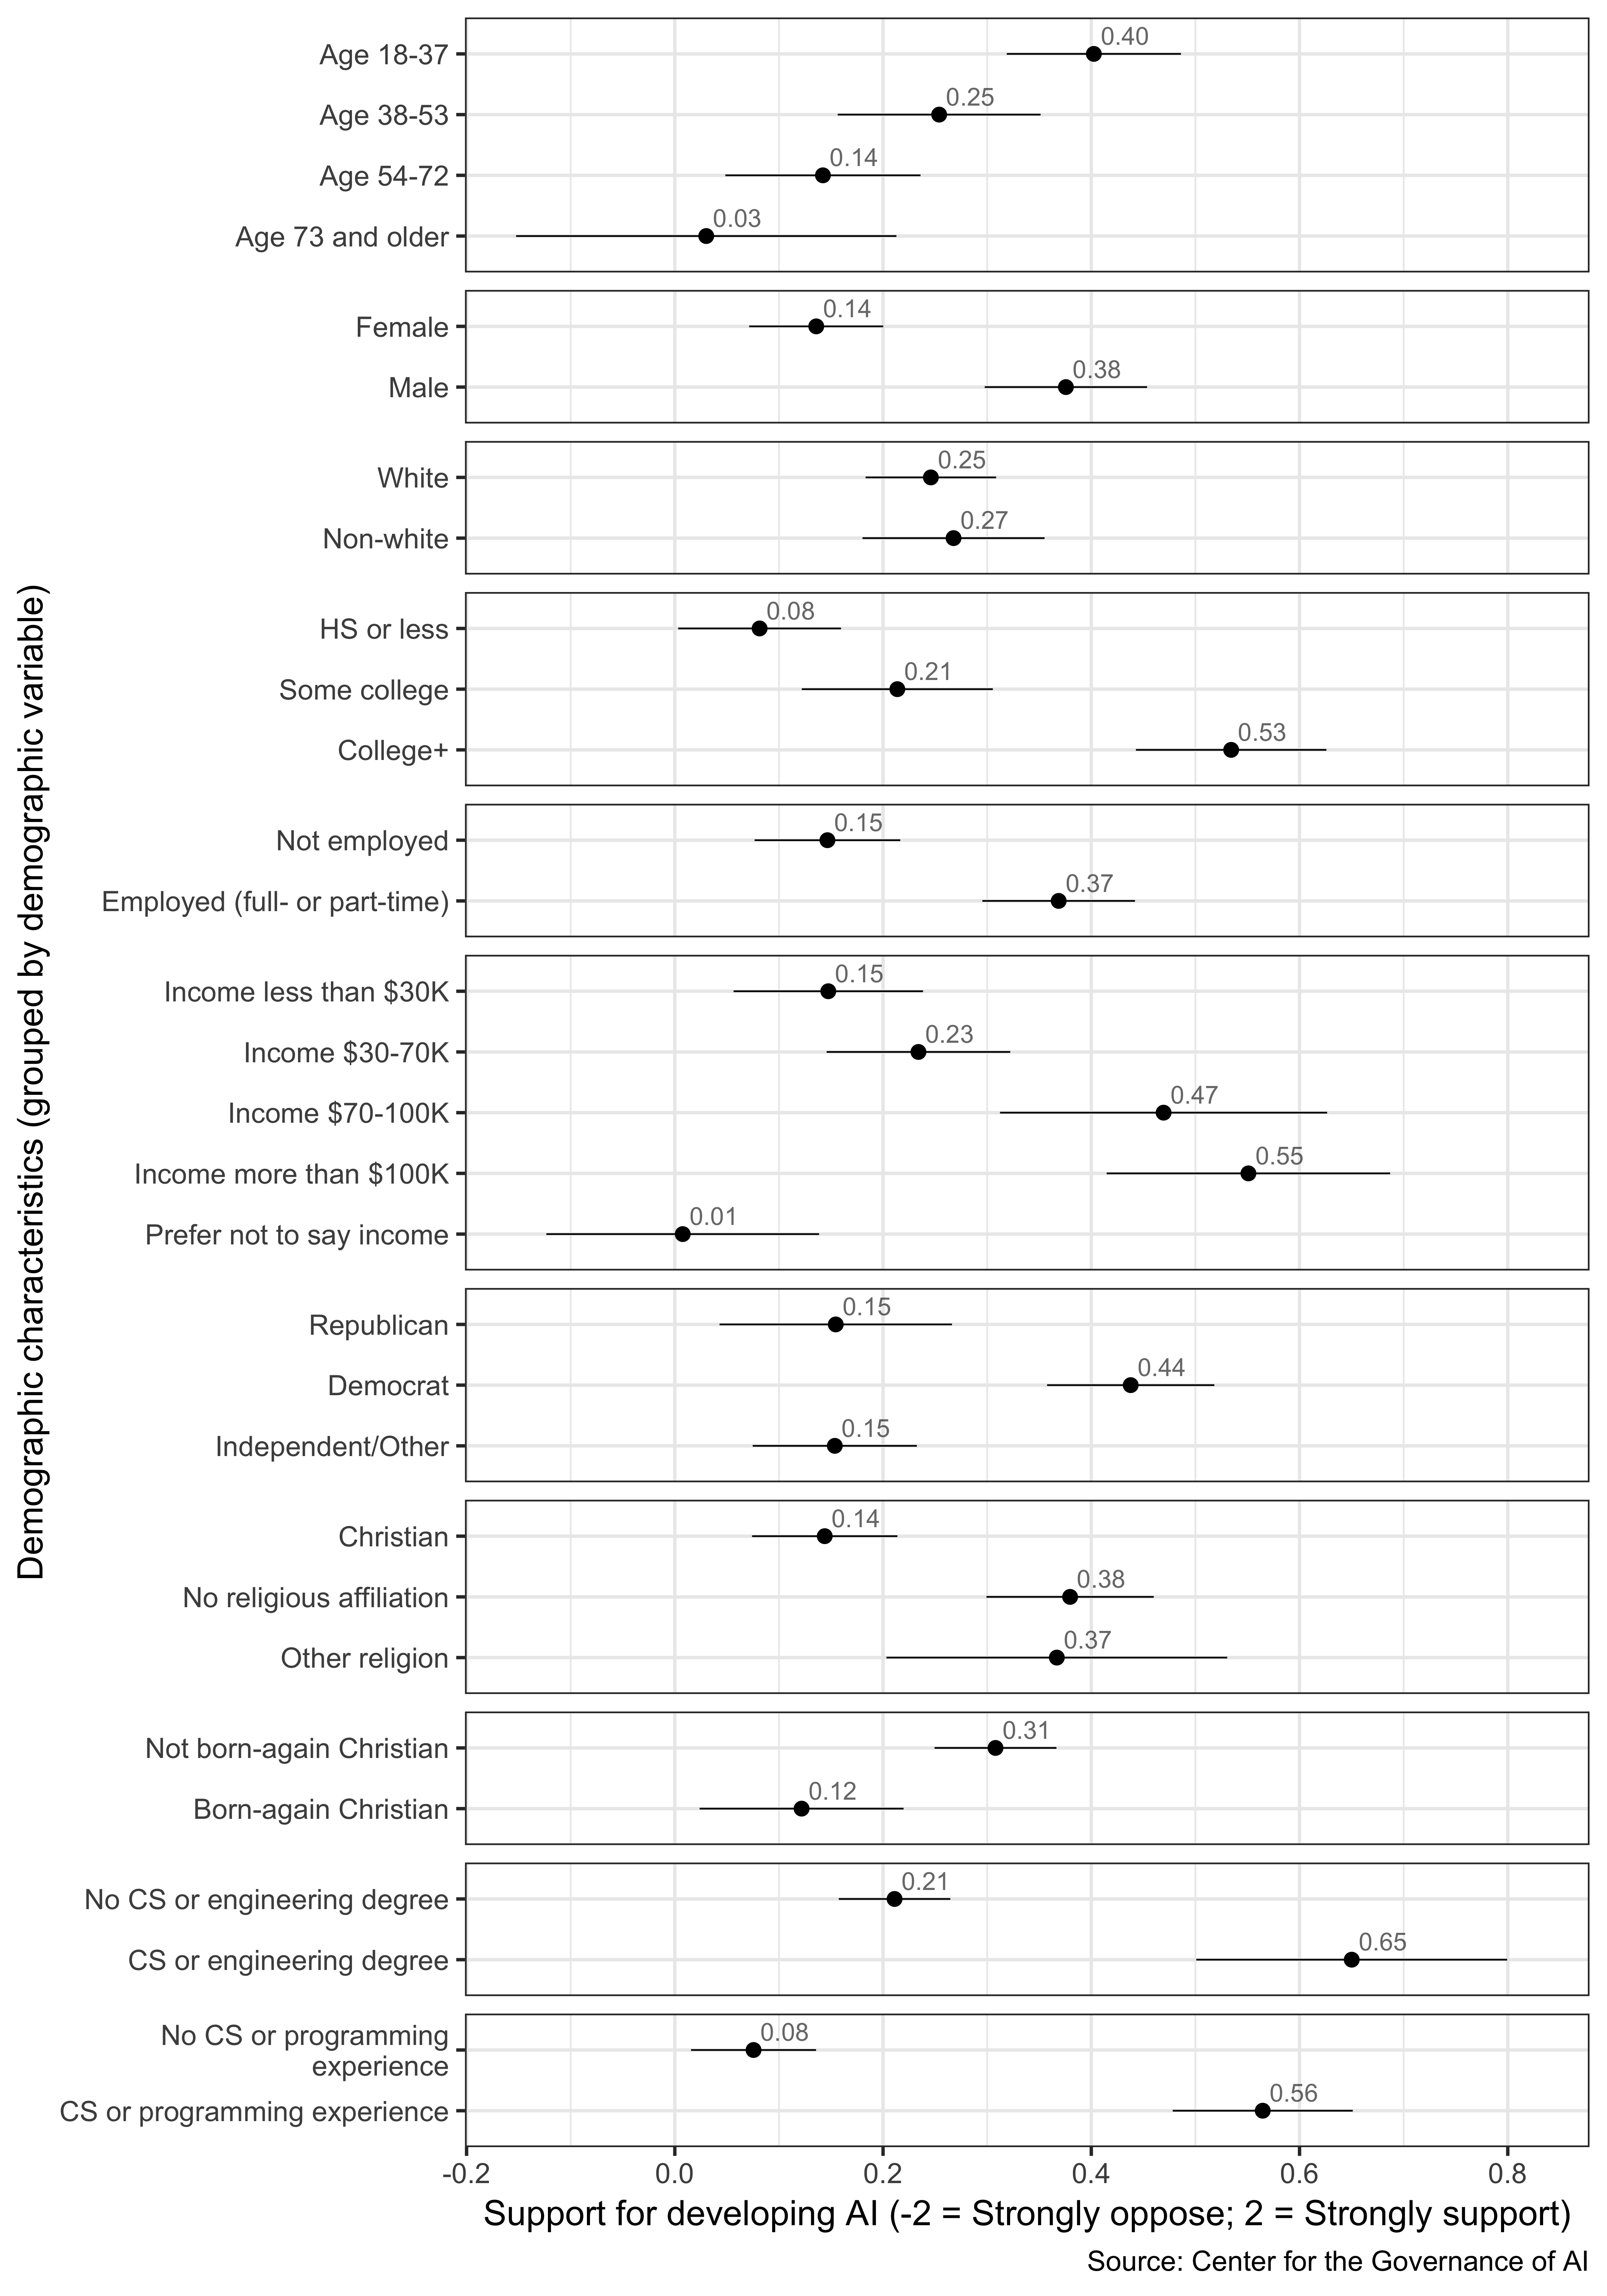
Figure 2.3: Support for developing AI across demographic characteristics: average support across groups
Some of the demographic differences we observe in this survey are in line with existing public opinion research. Below we highlight three salient predictors of support for AI based on the existing literature: gender, education, and income.
Around the world, women have viewed AI more negatively than men. Fifty-four percent of women in EU countries viewed AI positively, compared with 67% of men (Eurobarometer 2017). Likewise in the U.S., 44% of women perceived AI as unsafe – compared with 30% of men (Morning Consult 2017). This gender difference could be explained by the fact that women have expressed higher distrust of technology than men do. In the U.S., women, compared with men, were more likely to view genetically modified foods or foods treated with pesticides as unsafe to eat, to oppose building more nuclear power plants, and to oppose fracking (Funk and Rainie 2015).
One’s level of education also predicts one’s enthusiasm toward AI, according to existing research. Reflecting upon their own jobs, 32% of Americans with no college education thought that technology had increased their opportunities to advance – compared with 53% of Americans with a college degree (Smith and Anderson 2016). Reflecting on the economy at large, 38% of those with post-graduate education felt that automation had helped American workers while only 19% of those with less than a college degree thought so (Graham 2018). A similar trend holds in the EU: those with more years of education, relative to those with fewer years, were more likely to value AI as good for society and less likely to think that AI steals people’s jobs (Eurobarometer 2017).
Another significant demographic divide in attitudes toward AI is income: low-income respondents, compared with high-income respondents, view AI more negatively. For instance, 40% of EU residents who had difficulty paying their bills “most of the time” hold negative views toward robots and AI, compared with 27% of those who “almost never” or “never” had difficulty paying their bills (Eurobarometer 2017). In the U.S., 19% of those who made less than $50,000 annually think that they are likely to lose their job to automation – compared with only 8% of Americans who made more than $100,000 annually (Graham 2018). Furthermore, Americans’ belief that AI will help the economy, as well as their support for AI research is positively correlated with their income (Morning Consult 2017).
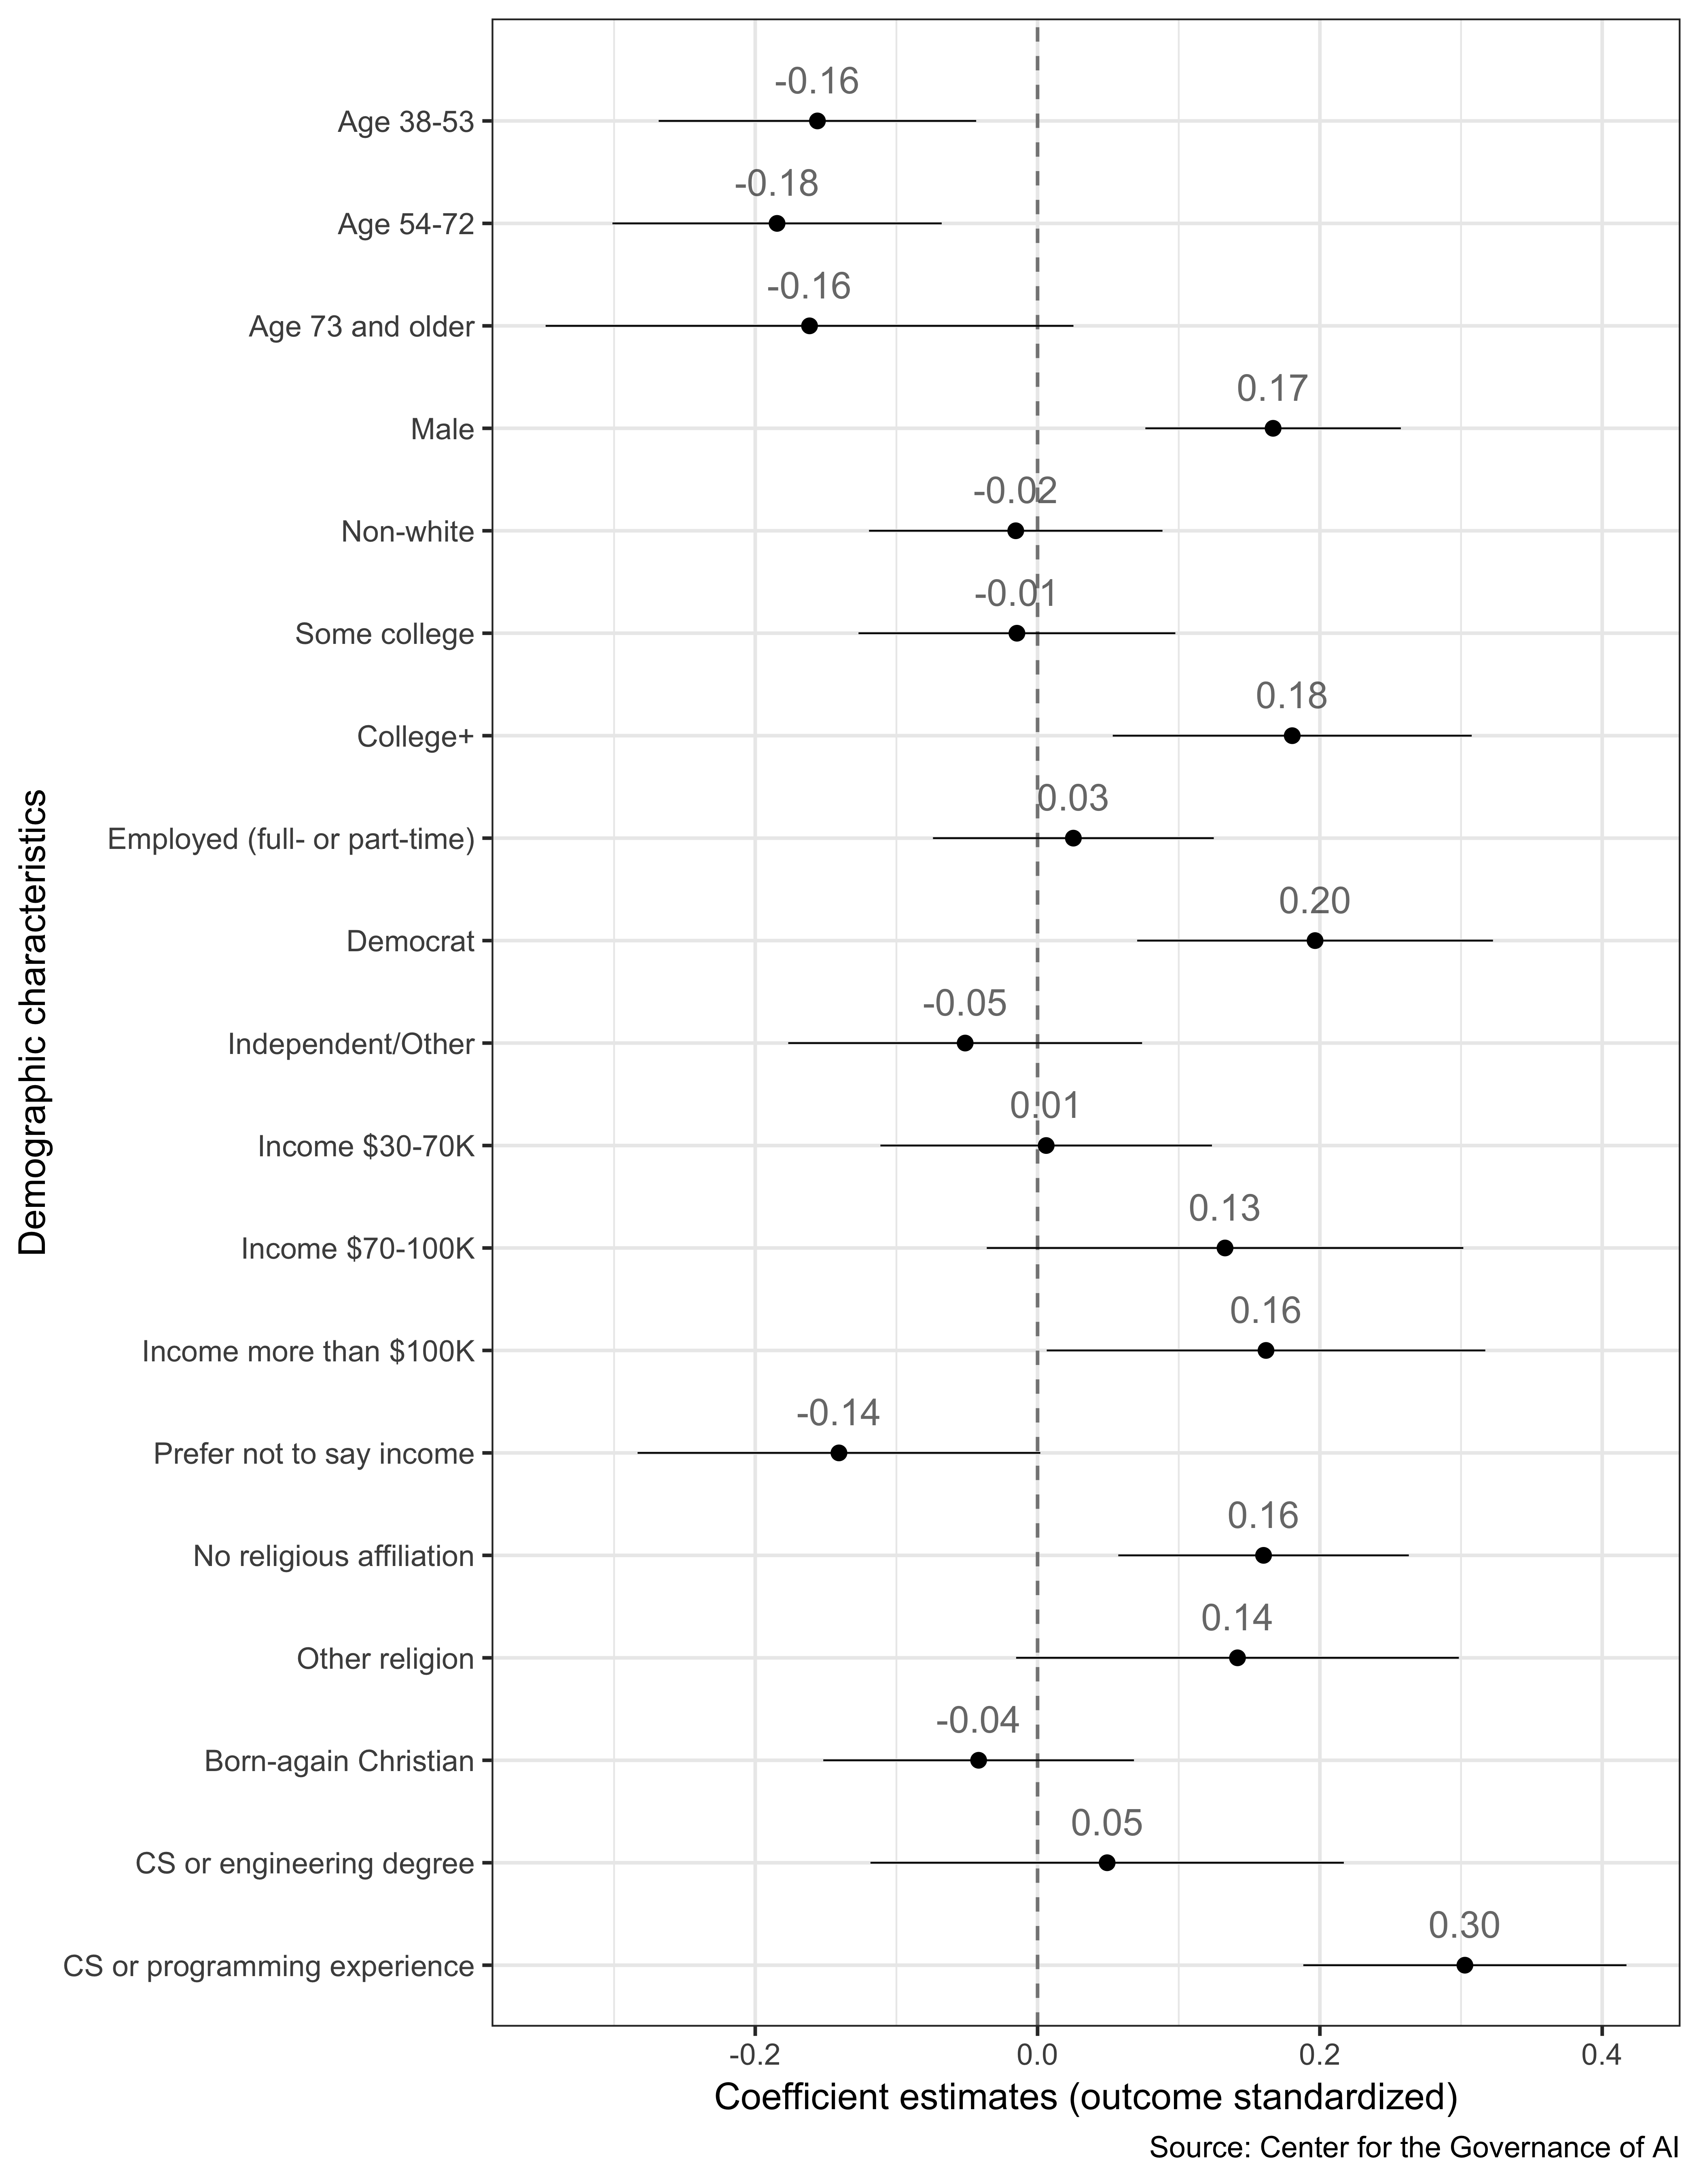
Figure 2.4: Predicting support for developing AI using demographic characteristics: results from a multiple linear regression that includes all demographic variables
2.3 An overwhelming majority of Americans think that AI and robots should be carefully managed
To compare Americans’ attitudes with those of EU residents, we performed a survey experiment that replicated a question from the 2017 Special Eurobarometer #460. (Details of the survey experiment are found in Appendix B.) The original question asked respondents to what extent they agree or disagree with the following statement:
Robots and artificial intelligence are technologies that require careful management.
We asked a similar question except respondents were randomly assigned to consider one of these three statements:
- AI and robots are technologies that require careful management.
- AI is a technology that requires careful management.
- Robots are technologies that require careful management.
Our respondents were given the same answer choices presented to the Eurobarometer subjects.
The overwhelming majority of Americans – more than eight in 10 – agree that AI and/or robots should be carefully managed, while only 6% disagree, as seen in Figure 2.5.5 We find that variations in the statement wording produce minor differences, statistically indistinguishable from zero, in responses.
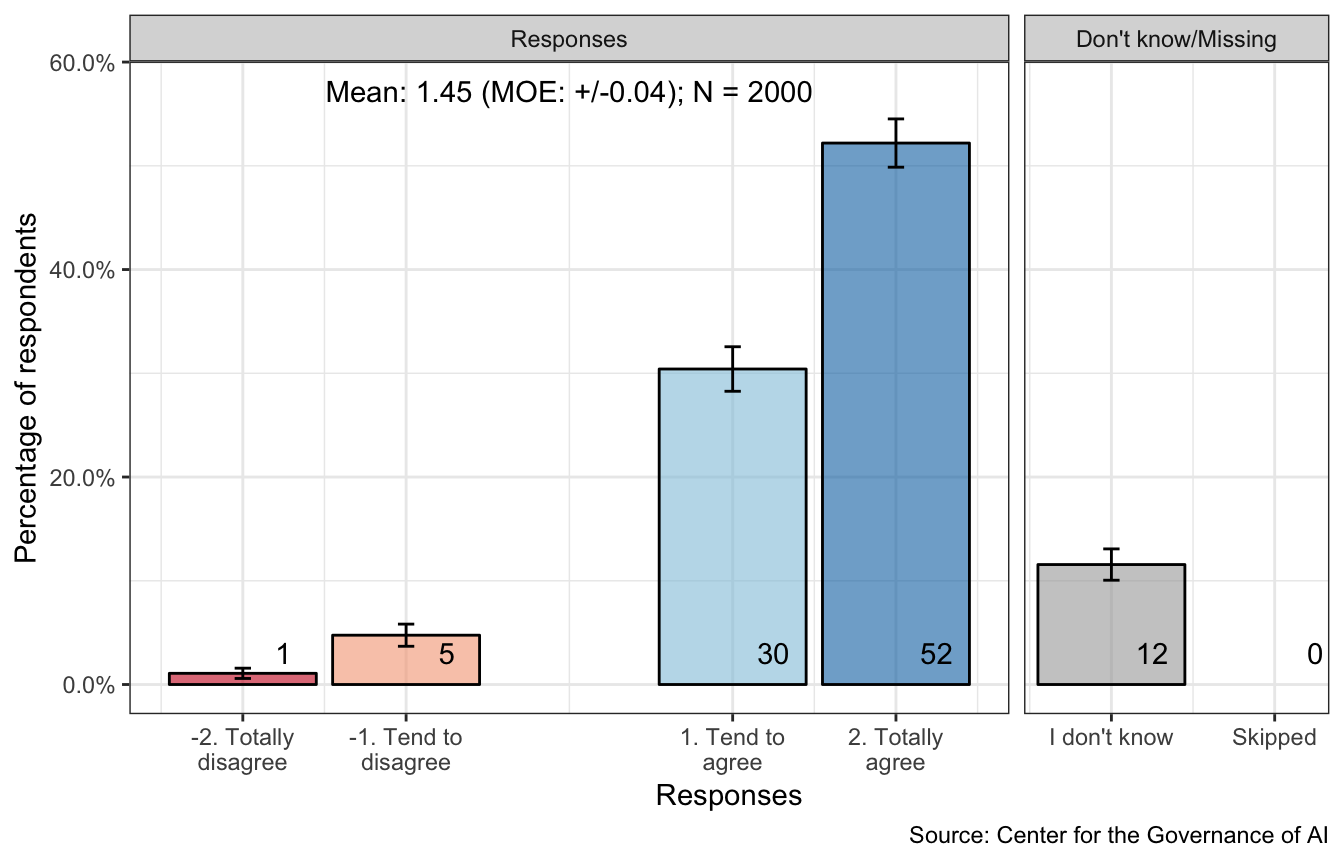
Figure 2.5: Agreement with statement that AI and/or robots should be carefully managed
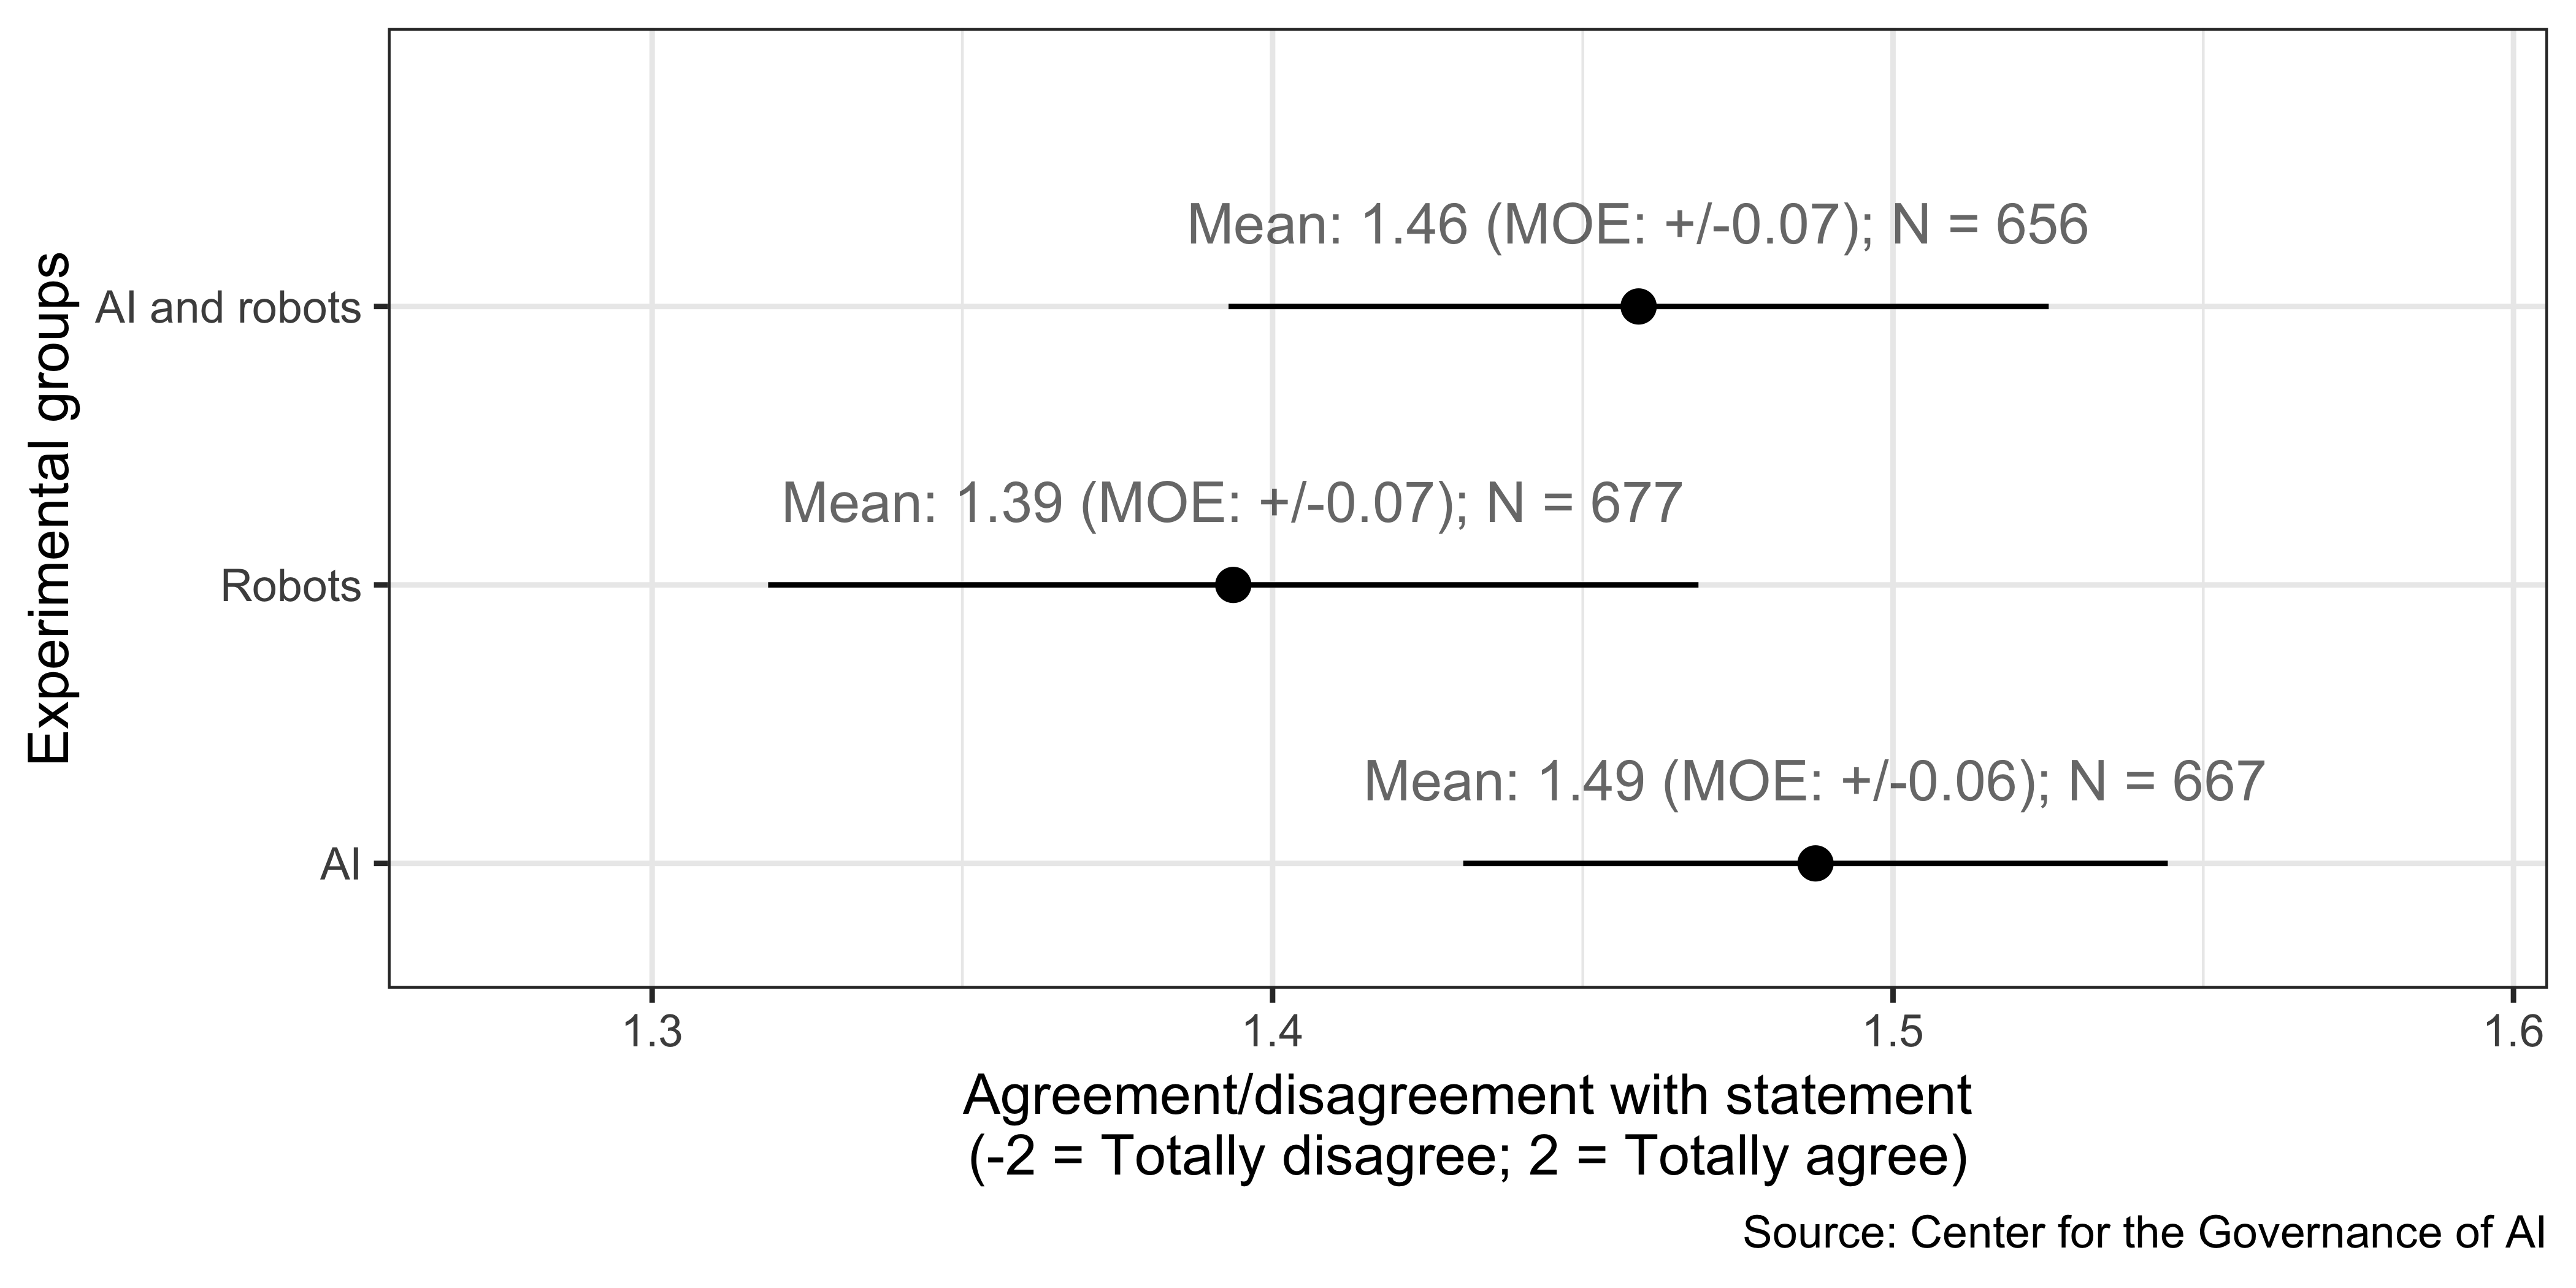
Figure 2.6: Agreement with statement that AI and/or robots should be carefully managed by experimental condition
Next, we compared our survey results with the responses from the 2017 Special Eurobarometer #460 by country (Eurobarometer 2017). For the U.S., we used all the responses to our survey question, unconditional on the experimental condition, because the variations in question-wording do not affect responses.
The percentage of those in the U.S. who agree with the statement (82%) is not far off from the EU average (88% agreed with the statement). Likewise, the percentage of Americans who disagree with the statement (6% disagree) is comparable with the EU average (7% disagreed). The U.S. ranks among the lowest regarding the agreement with the statement in part due to the relatively high percentage of respondents who selected the “don’t know” option.
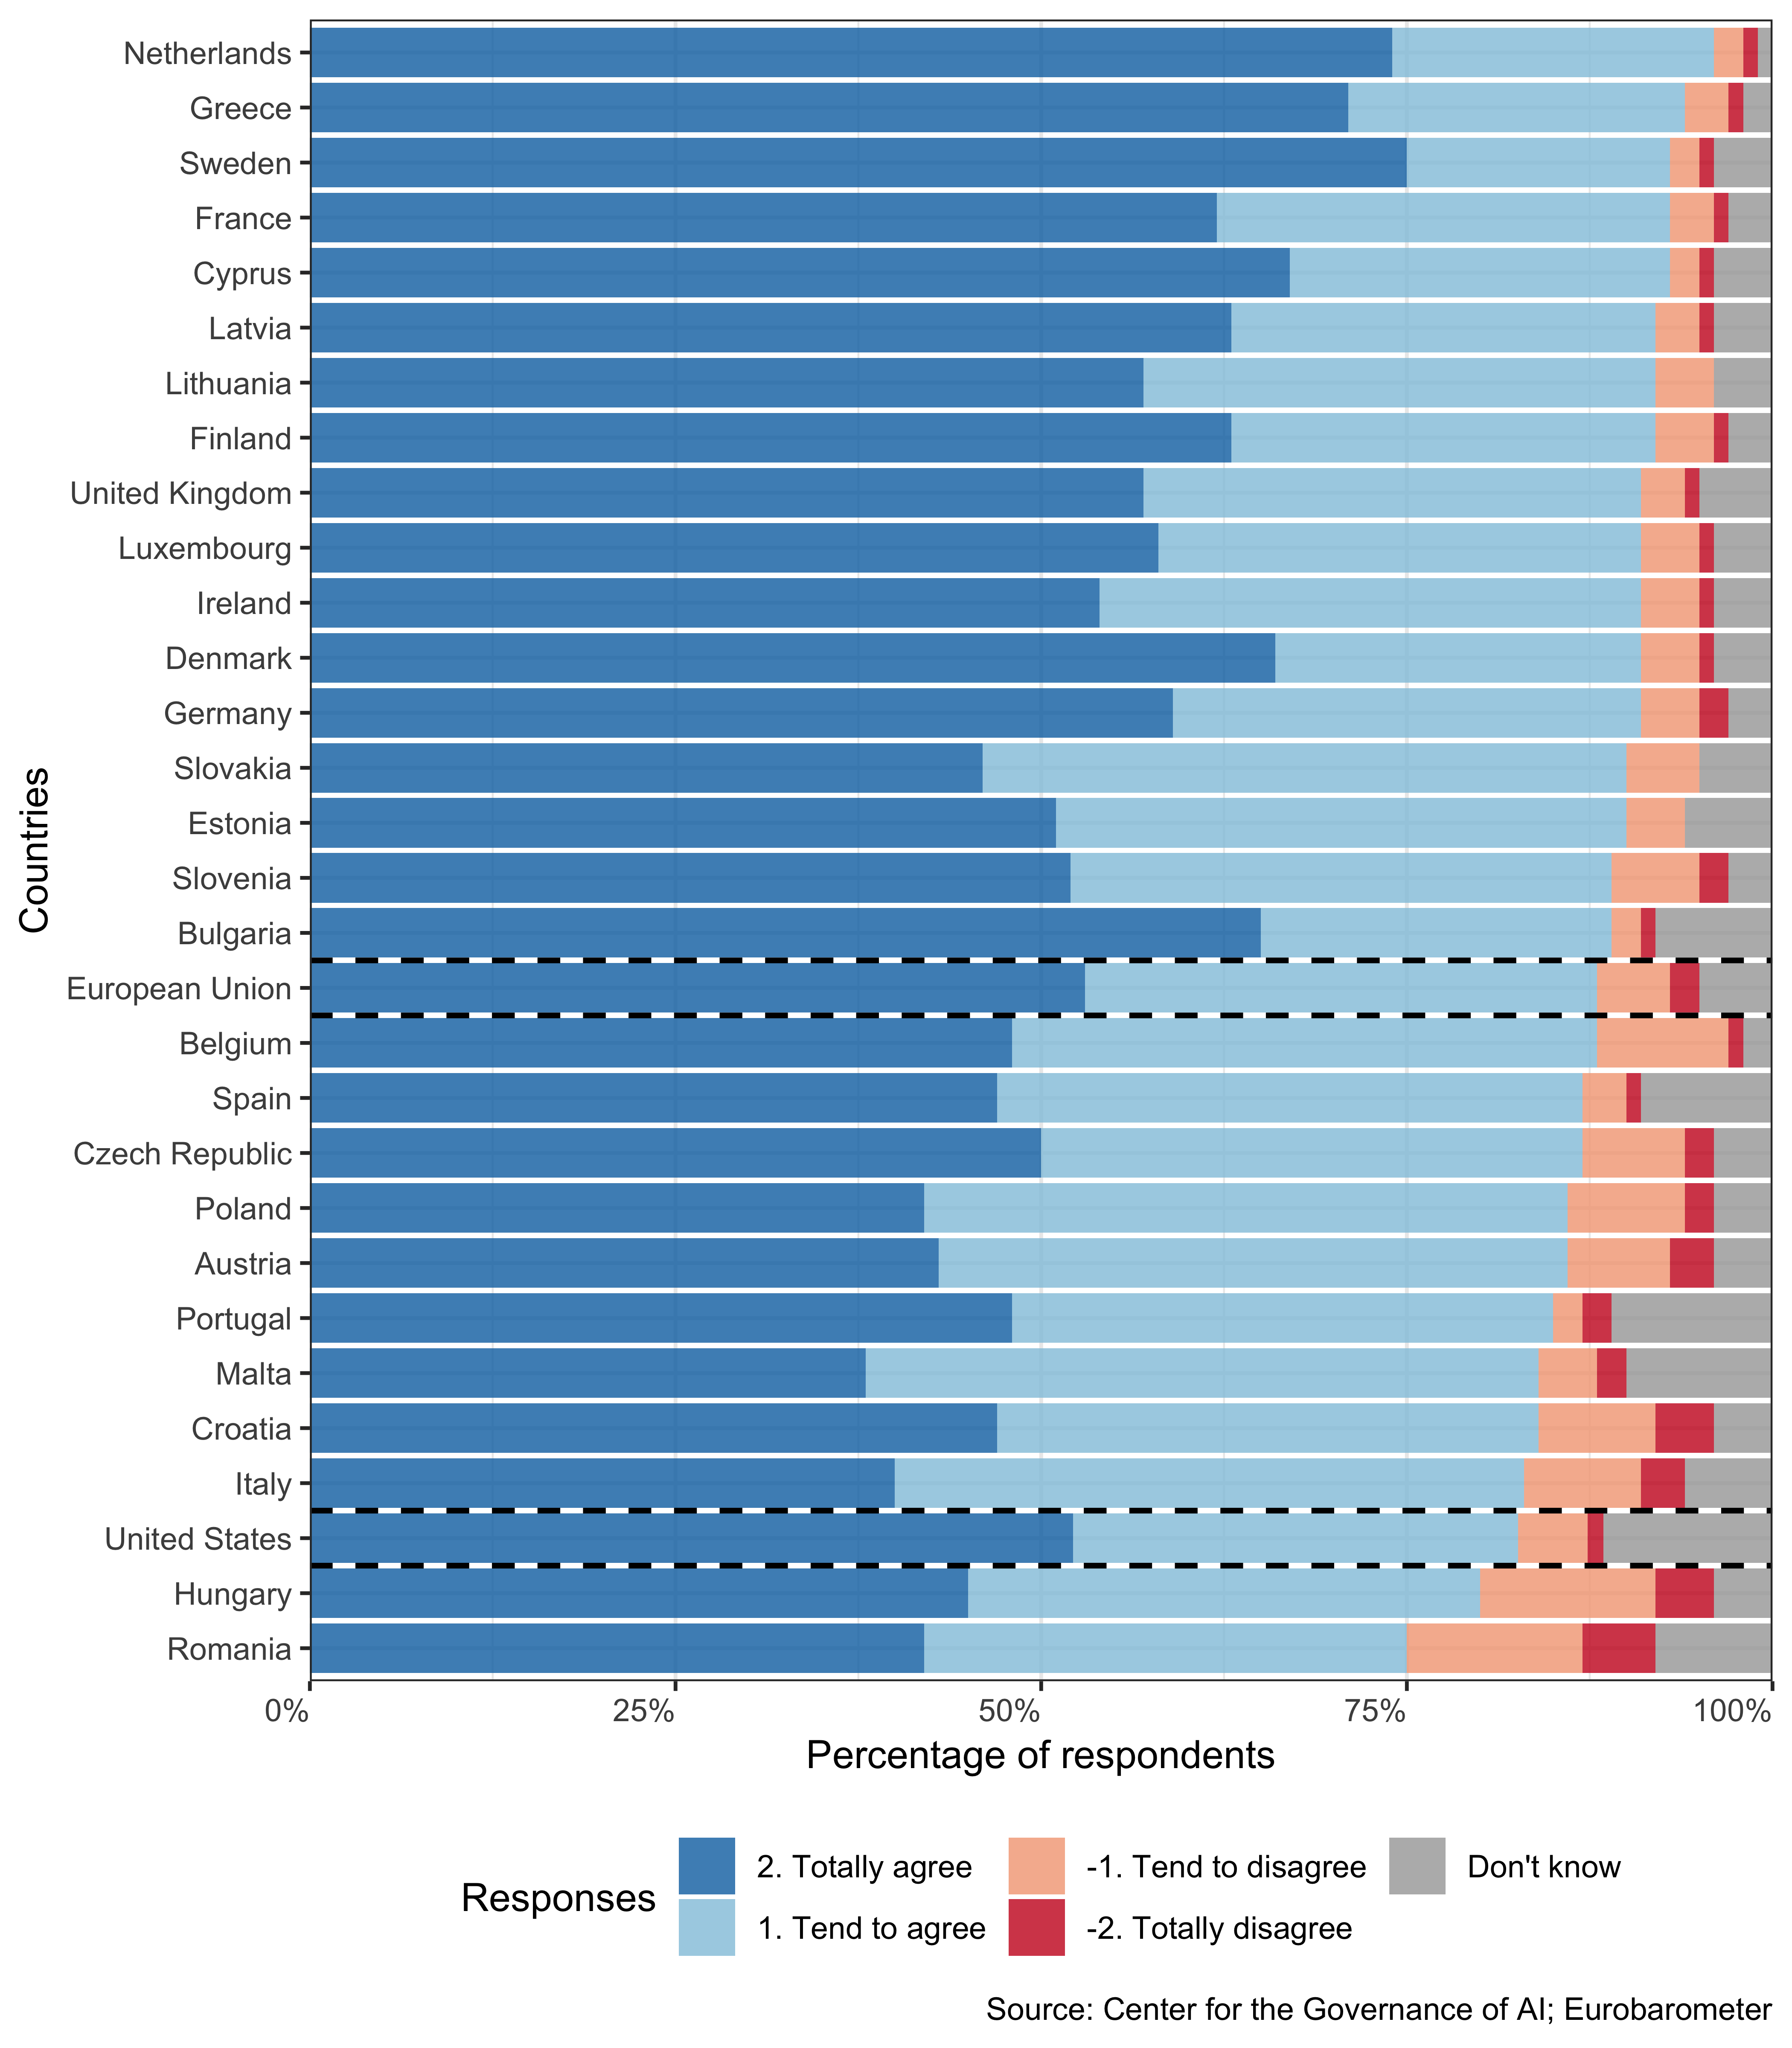
Figure 2.7: Agreement with statement that robots and AI require careful management (EU data from 2017 Special Eurobarometer #460)
2.4 Harmful consequences of AI in the context of other global risks
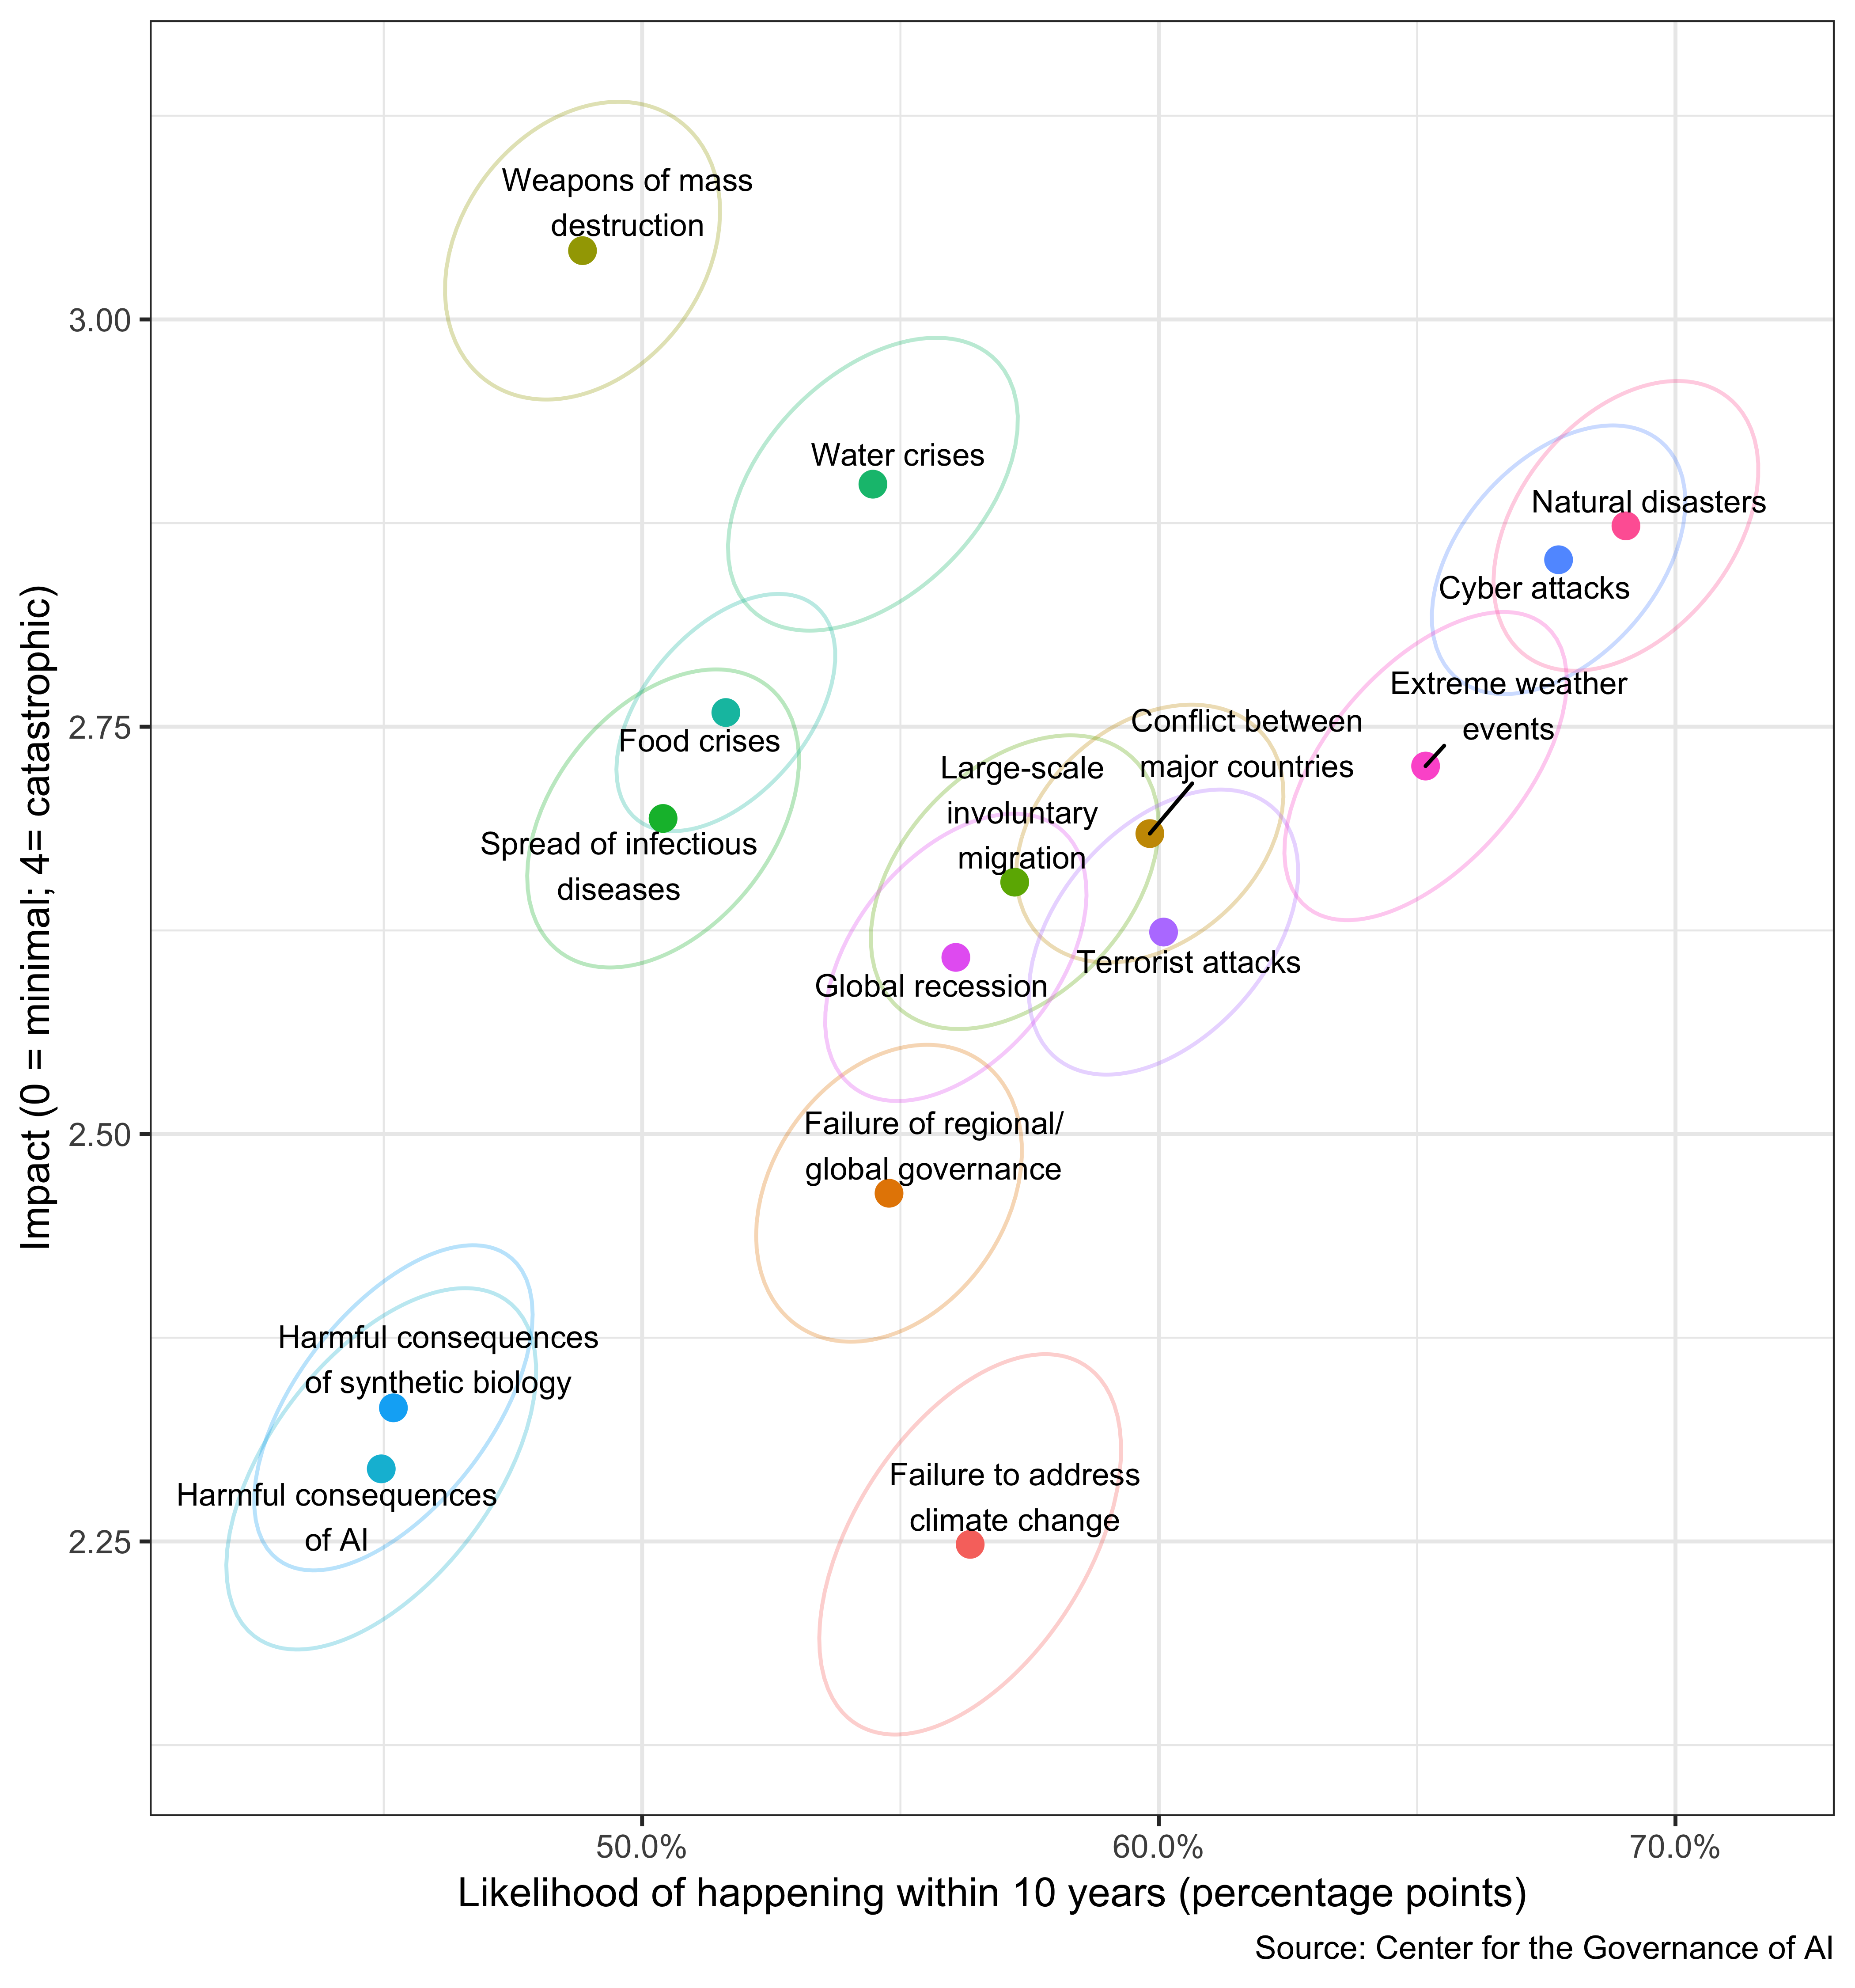
Figure 2.8: The American public’s perceptions of 15 potential global risks
At the beginning of the survey, respondents were asked to consider five out of 15 potential global risks (the descriptions are found in Appendix B). The purpose of this task was to compare respondents’ perception of AI as a global risk with their notions of other potential global risks. The global risks were selected from the Global Risks Report 2018, published by the World Economic Forum. We edited the description of each risk to be more comprehensible to non-expert respondents while preserving the substantive content. We gave the following definition for a global risk:
A “global risk” is an uncertain event or condition that, if it happens, could cause significant negative impact for at least 10 percent of the world’s population. That is, at least 1 in 10 people around the world could experience a significant negative impact.6
After considering each potential global risk, respondents were asked to evaluate the likelihood of it happening globally within 10 years, as well as its impact on several countries or industries.
We use a scatterplot (Figure 2.8 to visualize results from respondents’ evaluations of global risks. The x-axis is the perceived likelihood of the risk happening globally within 10 years. The y-axis is the perceived impact of the risk. The mean perceived likelihood and impact is represented by a dot. The corresponding ellipse contains the 95% confidence region.
In general, Americans perceive all these risks to be impactful: on average they rate each as having between a moderate (2) and severe (3) negative impact if they were to occur. Americans perceive the use of weapons of mass destruction to be the most impactful – at the “severe” level (mean score 3.0 out of 4). Although they do not think this risk as likely as other risks, they still assign it an average of 49% probability of occurring within 10 years. Risks in the upper-right quadrant are perceived to be the most likely as well as the most impactful. These include natural disasters, cyber attacks, and extreme weather events.
The American public and the nearly 1,000 experts surveyed by the World Economic Forum share similar views regarding most of the potential global risks we asked about (World Economic Forum 2018). Both the public and the experts rank extreme weather events, natural disasters, and cyber attacks as the top three most likely global risks; likewise, both groups consider weapons of mass destruction to be the most impactful. Nevertheless, compared with experts, Americans offer a lower estimate of the likelihood and impact of the failure to address climate change.
The American public appears to over-estimate the likelihoods of these risks materializing within 10 years. The mean responses suggest (assuming independence) that about eight (out of 15) of these global risks, which would have a significant negative impact on at least 10% of the world’s population, will take place in the next 10 years. One explanation for this is that it arises from the broad misconception that the world is in a much worse state than it is in reality (Pinker 2018; Rosling, Rönnlund, and Rosling 2018). Another explanation is that it arises as a byproduct of respondents interpreting “significant negative impact” in a relatively minimal way, though this interpretation is hard to sustain given the mean severity being between “moderate” and “severe.” Finally, this result may be because subjects centered their responses within the distribution of our response options, the middle value of which was the 40-60% option; thus, the likelihoods should not be interpreted literally in the absolute sense.
The adverse consequences of AI within the next 10 years appear to be a relatively low priority in respondents’ assessment of global risks. It – along with adverse consequences of synthetic biology – occupy the lower left quadrant, which contains what are perceived to be lower-probability, lower-impact risks.7 These risks are perceived to be as impactful (within the next 10 years) as the failure to address climate change, though less probable. One interpretation of this is that the average American simply does not regard AI as posing a substantial global risk. This interpretation, however, would be in tension with some expert assessment of catastrophic risks that suggests unsafe AI could pose significant danger (World Economic Forum 2018; Sandberg and Bostrom 2008). The gap between experts and the public’s assessment suggests that this is a fruitful area for efforts to educate the public.
Another interpretation of our results is that Americans do have substantial concerns about the long-run impacts of advanced AI, but they do not see these risks as likely in the coming 10 years. As support for this interpretation, we later find that 12% of American’s believe the impact of high-level machine intelligence will be “extremely bad, possibly human extinction,” and 21% that it will be “on balance bad.” Still, even though the median respondent expects around a 54% chance of high level machine intelligence within 10 years, respondents may believe that the risks from high level machine intelligence will manifest years later. If we assume respondents believe global catastrophic risks from AI only emerge from high-level AI, we can infer an implied global risk, conditional on high-level AI (within 10 years), of 80%. Future work should try to unpack and understand these beliefs.
2.5 Americans’ understanding of key technology terms
We used a survey experiment to understand how the public understands the terms AI, automation, machine learning, and robotics. (Details of the survey experiment are found in Appendix B.) We randomly assigned each respondent one of these terms and asked them:
In your opinion, which of the following technologies, if any, uses [artificial intelligence (AI)/automation/machine learning/robotics]? Select all that apply.
Because we wanted to understand respondents’ perceptions of these terms, we did not define any of the terms. Respondents were asked to consider 10 technological applications, each of which uses AI or machine learning.
Though the respondents show at least a partial understanding of the terms and can identify their use within the considered technological applications correctly, the respondents underestimate the prevalence of AI, machine learning, and robotics in everyday technological applications, as reported in Figure 2.9. (See Appendix C for details of our statistical analysis.)
Among those assigned the term AI, a majority think that virtual assistants (63%), smart speakers (55%), driverless cars (56%), social robots (64%), and autonomous drones use AI (54%). Nevertheless, a majority of respondents assume that Facebook photo tagging, Google Search, Netflix or Amazon recommendations, or Google Translate do not use AI.
Why did so few respondents consider the products and services we listed to be applications of AI, automation, machine learning, or robotics?
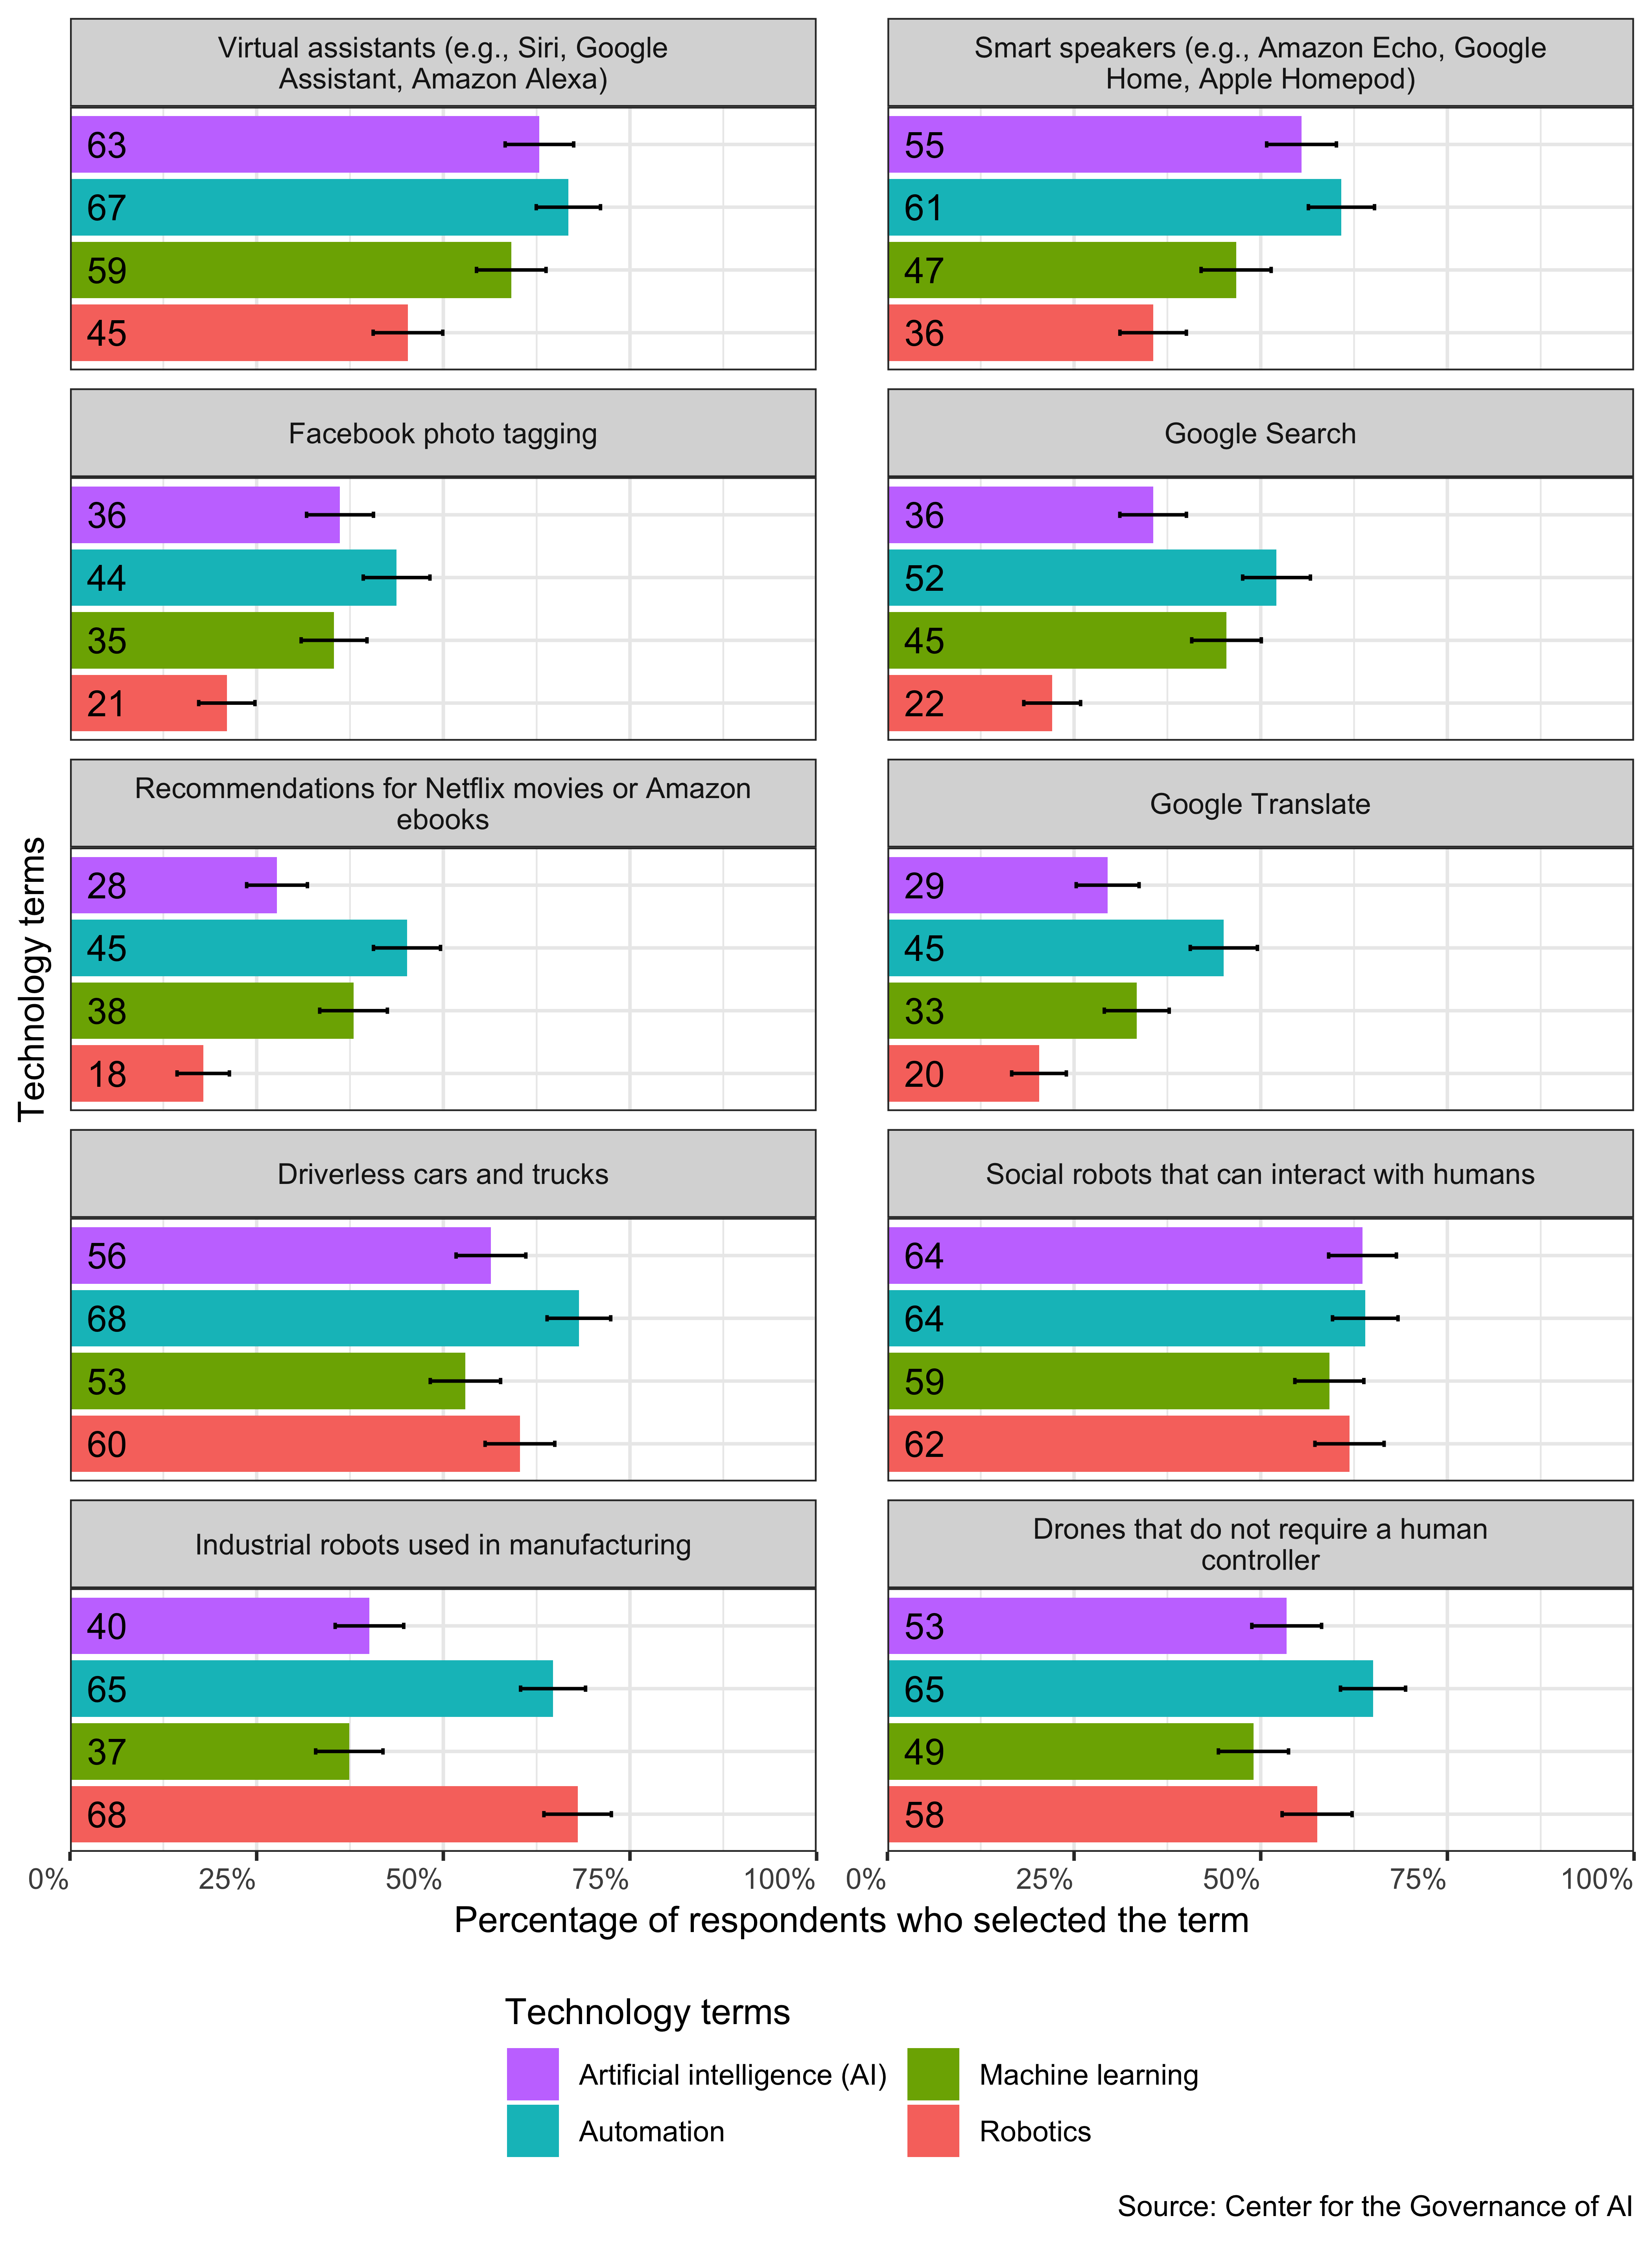
Figure 2.9: What applications or products that the public thinks use AI, automation, machine learning, or robotics
A straightforward explanation is that inattentive respondents neglect to carefully consider or select the items presented to them (i.e., non-response bias). Even among those assigned the term robotics, only 62% selected social robots and 68% selected industrial robots. Our analysis (found in Appendix C) confirms that respondent inattention, defined as spending too little or too much time on the survey, predicts non-response to this question.
Another potential explanation for the results is that the American public – like the public elsewhere – lack awareness of AI or machine learning. As a result, the public does not know that many tech products and services use AI or machine learning. According to a 2017 survey, nearly half of Americans reported that they were unfamiliar with AI (Morning Consult 2017). In the same year, only 9% of the British public said they had heard of the term “machine learning” (Ipsos MORI 2018). Similarly, less than half of EU residents reported hearing, reading, or seeing something about AI in the previous year (Eurobarometer 2017).
Finally, the so-called “AI effect” could also explain the survey result. The AI effect describes the phenomenon that the public does not consider an application that uses AI to utilize AI once that application becomes commonplace (McCorduck 2004). Because 85% of Americans report using digital products that deploy AI (e.g., navigation apps, video or music streaming apps, digital personal assistants on smartphones, etc.) (Reinhart 2018), they may not think that these everyday applications deploy AI.
References
Eurobarometer. 2017. “Special Eurobarometer 460: Attitudes Towards the Impact of Digitisation and Automation on Daily Life.” Eurobarometer. https://perma.cc/9FRT-ADST.
Funk, Cary, and Lee Rainie. 2015. “Public and Scientists’ Views on Science and Society.” Survey report. Pew Research Center. https://perma.cc/9XSJ-8AJA.
Graham, Edward. 2018. “Views on Automation’s U.s. Workforce Impact Highlight Demographic Divide.” Morning Consult. https://perma.cc/544D-WRUM.
Ipsos MORI. 2018. “Public Views of Machine Learning: Findings from Public Research and Engagement Conducted on Behalf of the Royal Society.” Survey report. The Royal Society. https://perma.cc/79FE-TEHH.
McCorduck, Pamela. 2004. Machines Who Think: A Personal Inquiry into the History and Prospects of Artificial Intelligence. New York: A K Peters/CRC Press.
Morning Consult. 2017. “National Tracking Poll 170401.” Survey report. Morning Consult. https://perma.cc/TBJ9-CB5K.
Nedelkoska, Ljubica, and Glenda Quintini. 2018. “Automation, Skills Use and Training.” Working Papers No. 202. Organisation for Economic Co-operation; Development. https://doi.org/10.1787/2e2f4eea-en.
Northeastern University and Gallup. 2018. “Optimism and Anxiety: Views on the Impact of Artificial Intelligence and Higher Education’s Response.” Survey report. Northeastern University; Gallup. https://perma.cc/57NW-XCQN.
Pinker, Steven. 2018. Enlightenment Now: The Case for Reason, Science, Humanism, and Progress. New York: Penguin.
Reinhart, RJ. 2018. “Most Americans Already Using Artificial Intelligence Products.” Survey report. Gallup. https://perma.cc/RVY5-WP9W.
Rosling, Hans, Anna Rosling Rönnlund, and Ola Rosling. 2018. Factfulness: Ten Reasons We’re Wrong About the World–and Why Things Are Better Than You Think. New York: Flatiron Books.
Sandberg, Anders, and Nick Bostrom. 2008. “Global Catastrophic Risks Survey.” Future of Humanity Institute, Oxford University. https://perma.cc/TA97-KD3Z.
Smith, Aaron, and Monica Anderson. 2016. “Automation in Everyday Life.” Pew Research Center. https://perma.cc/WU6B-63PZ.
World Economic Forum. 2018. “The Global Risks Report 2018: 13th Edition.” World Economic Forum. https://perma.cc/8XM8-LKEN.
These percentages that we discuss here reflect the average response across the three statements. See Appendix B for the topline result for each statement.↩
Our definition of global risk borrowed from the Global Challenges Foundation’s definition: “an uncertain event or condition that, if it happens, can cause a significant negative impact on at least 10% of the world’s population within the next 10 years” (Cotton-Barratt et al. 2016).↩
The World Economic Forum’s survey asked experts to evaluate the “adverse consequences of technological advances,” defined as “[i]ntended or unintended adverse consequences of technological advances such as artificial intelligence, geo-engineering and synthetic biology causing human, environmental and economic damage.” The experts considered these “adverse consequences of technological advances” to be less likely and lower-impact, compared with other potential risks.↩